
 Printable PDF
Microsoft PL-300 dumps - 100% Pass Guarantee!
Vendor: Microsoft
Certifications: Microsoft Certifications
Exam Name: Microsoft Power BI Data Analyst
Exam Code: PL-300
Total Questions: 400 Q&As ( View Details)
Last Updated: Mar 12, 2025
Note: Product instant download. Please sign in and click My account to download your product.

- Q&As Identical to the VCE Product
- Windows, Mac, Linux, Mobile Phone
- Printable PDF without Watermark
- Instant Download Access
- Download Free PDF Demo
- Includes 365 Days of Free Updates

VCE
- Q&As Identical to the PDF Product
- Windows Only
- Simulates a Real Exam Environment
- Review Test History and Performance
- Instant Download Access
- Includes 365 Days of Free Updates
Microsoft PL-300 Last Month Results
 98.6% Pass Rate
- 365 Days Free Update
- Verified By Professional IT Experts
- 24/7 Live Support
- Instant Download PDF&VCE
- 3 Days Preparation Before Test
- 18 Years Experience
- 6000+ IT Exam Dumps
- 100% Safe Shopping Experience
PL-300 Q&A's Detail
| Exam Code: | PL-300 |
| Total Questions: | 400 |
| Single & Multiple Choice | 262 |
| Drag Drop | 42 |
| Hotspot | 96 |
| Testlet | 3 |
CertBus Has the Latest PL-300 Exam Dumps in Both PDF and VCE Format
- Microsoft_certbus_PL-300_by_JJ_283.pdf
- 683.66 KB
- Microsoft_certbus_PL-300_by_Lakshmanan_282.pdf
- 416.33 KB
- Microsoft_certbus_PL-300_by_Developer_318.pdf
- 292.46 KB
- Microsoft_certbus_PL-300_by_ccnp_Swicth_??_308.pdf
- 390.32 KB
- Microsoft_certbus_PL-300_by_alsayed_290.pdf
- 573.04 KB
- Microsoft_certbus_PL-300_by_AMIR_BEN_HSOUNA_300.pdf
- 637.89 KB
PL-300 Online Practice Questions and Answers
You need to create the On-Time Shipping report. The report must include a visualization that shows the percentage of late orders. Which type of visualization should you create?
A. bar chart
B. scatterplot
C. pie chart
You have a CSV file that contains user complaints. The file contains a column named Logged logged contains the date and time each complaint occurred. The data in Logged is m the following format: 2018-12-31 at 08:59.
You need to be able to analyze the complaints by the logged date and use a built-in date hierarchy.
What should you do?
A. Create a column by example that starts with 2018-12-31.
B. Create a column by example that starts with 2018-12-31 and set the data type of the new column to Date
C. Apply the parse function from the Date transformations options to the Logged column.
D. Add a conditional column that outputs 2018 if the Logged column starts with 2018 and set the data type of the new column to Whole Number.
You have a Power Bl model that contains the following data.
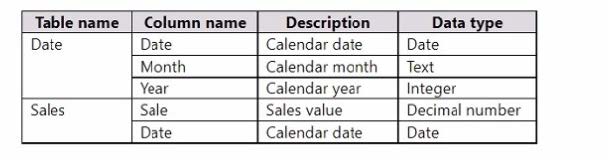
The Date table relates to the Sales table by using the Date columns.
The model contains the following DAX measure.
Total Sales = SUM(Sales[Sale])
You need to create another measure named Previous Quarter to display the sales one quarter before the selected period.
Which DAX calculation should you use?
A. CALCULATE < [Total Sales], OATEADD (Date[Date], -1, QUARTER))
B. CALCULATE ([Total Sales], DATESQTD (Date[Date]))
C. TOTALQTD ([Total Sales], Date[Date])
D. CALCULATE < [Total Sales], PARALLELPERIOO (Date[Date], 1, QUARTER))
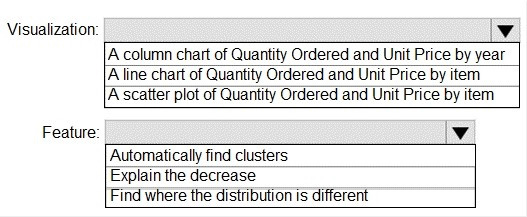
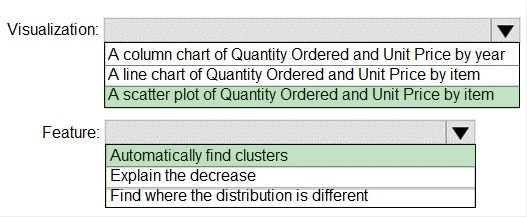
HOTSPOT
You have a dataset named Pens that contains the following columns:
1.
Unit Price
2.
Quantity Ordered
You need to create a visualization that shows the relationship between Unit Price and Quantity Ordered. The solution must highlight orders that have a similar unit price and ordered quantity.
Which type of visualization and which feature should you use? To answer, select the appropriate options in the answer area.
NOTE: Each correct selection is worth one point.
Hot Area:
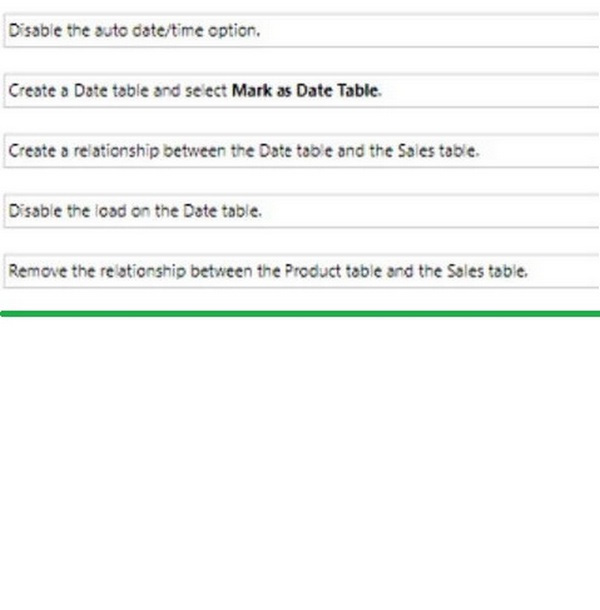
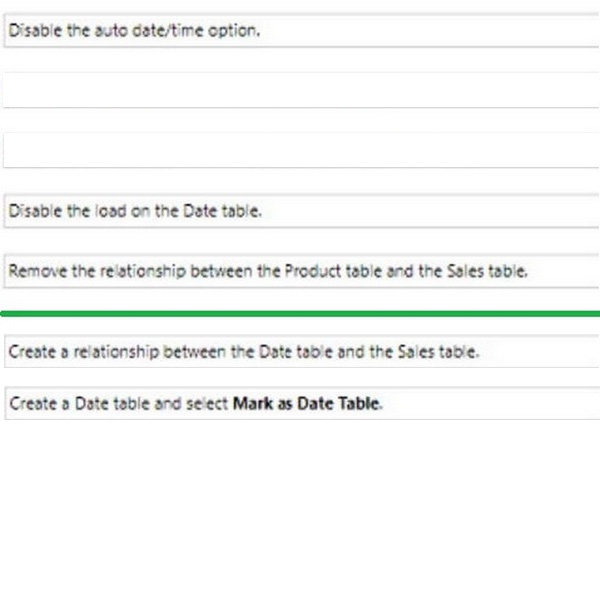
DRAG DROP
You have a Power BI data model that analyzes product sales ever time. The data model contains the following tables.
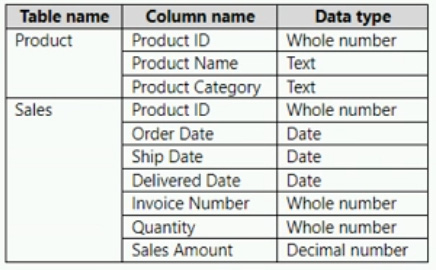
A one-to-many relationship exists between the tables.
The auto date/time option for the data model is enabled.
You need to reduce the size of the data model while maintaining the ability to analyze product sales by month and quarter.
Which two actions should you perform? Each correct answer presents part of the solution.
NOTE: Each correct answer is worth one point.
Select and Place:
Add Comments
Success Stories
- Pakistan
- Keeley
- Mar 21, 2025
- Rating: 4.8 / 5.0
![]()
Valid material !! I will continue using this material and introduced it to other friend. Good thing should be shared with friend.
- Hull
- Christopher
- Mar 19, 2025
- Rating: 5.0 / 5.0
I passed the exam yesterday. I got no new questions. All questions were in their dumps. I also got many question which are exactly the same as this dumps, even the sequence of the options. So I think their questions are valid and quite up to date. Go through the questions carefully and understand the answers, you will surely pass the exam in a short time. Good luck!
- India
- Abbie
- Mar 19, 2025
- Rating: 4.5 / 5.0
![]()
I passed my exam this morning. I prepared with this dumps two weeks ago. This dumps is very valid. All the questions were in my exam. I still got 2 new questions but luckily they are easy for me. Thanks for your help. I will recommend you to everyone I know.
- Alberta
- Dorsey
- Mar 19, 2025
- Rating: 5.0 / 5.0
I got all questions from this dumps. I think I answered 2 questions wrong because I passed my exam with 96% of the full score. Questions may change in the real exam. So be sure to read your questions carefully in your actual exam. Pay attention to the orders of each option, too.
- India
- YIYI
- Mar 16, 2025
- Rating: 4.2 / 5.0
![]()
today all the question are from this dumps, so i passed the exam without doubt. thanks for it. Recommend.
- United States
- Donn
- Mar 16, 2025
- Rating: 4.7 / 5.0
![]()
This dumps is still very valid, I have cleared the written exams passed today. Recommend.
- Sri Lanka
- Miltenberger
- Mar 14, 2025
- Rating: 4.8 / 5.0
![]()
passed today. I think it is very useful and enough for your exam, so trust on it and you will achieve success.
- Indonesia
- Ravi
- Mar 14, 2025
- Rating: 4.3 / 5.0
![]()
Valid study material! Go get it now!!!
- Michigan
- Jason
- Mar 13, 2025
- Rating: 5.0 / 5.0
I'm really glad I had starting dealing with this first before starting my PL-300 exam. They did a great job in being clear and concise without deviating. They cover the domains in more detail in a straight to point approach without dragging out in stories. I also feel that the practice exams are very helpful as it has helped me narrow down weaker areas that need more time to focus on.
- Washington
- Ron Ferguson
- Mar 13, 2025
- Rating: 5.0 / 5.0
The dumps is quite valid. I got all questions from this dumps and passed with a full score. I don't know why people give bad comment on this site. I think their dumps are really up to date and accurate. If you do not have enough time to prepare for your exam, it's enough to use this dumps only. They update the questions very frequently. You may get new questions in a short time after the exam questions changed.
Microsoft PL-300 exam official information: As a candidate for this exam, you should deliver actionable insights by working with available data and applying domain expertise.
Why select/choose certbus.com?
Millions of interested professionals can touch the destination of success in exams by certbus.com. products which would be available, affordable, updated and of really best quality to overcome the difficulties of any course outlines. Questions and Answers material is updated in highly outclass manner on regular basis and material is released periodically and is available in testing centers with whom we are maintaining our relationship to get latest material.
![]()
![]()
Copyright © 2004-2025 certbus.com, All Rights Reserved.