PL-300 Online Practice Questions and Answers
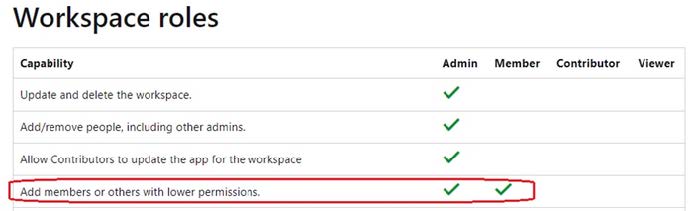
You need to provide a user with the ability to add members to a workspace. The solution must use the principle of least privilege. Which role should you assign to the user?
A. Viewer
B. Contributor
C. Member
D. Admin
Note: This question is part of a series of questions that present the same scenario. Each question in the series contains a unique solution that might meet the stated goals. Some question sets might have more than one correct solution, while
others might not have a correct solution.
After you answer a question in this section, you will NOT be able to return to it. As a result, these questions will not appear in the review screen.
You have a Power BI report that imports a date table and a sales table from an Azure SQL database data source. The sales table has the following date foreign keys:
1.
Due Date
2.
Order Date
3.
Delivery Date
You need to support the analysis of sales over time based on all the date foreign keys.
Solution: For each date foreign key, you add inactive relationships between the sales table and the date table.
Does this meet the goal?
A. Yes
B. No
Note: This question is part of a series of questions that present the same scenario. Each question in the series contains a unique solution that might meet the stated goals. Some question sets might have more than one correct solution, while
others might not have a correct solution.
After you answer a question in this scenario, you will NOT be able to return to it. As a result, these questions will not appear in the review screen.
You have several reports and dashboards in a workspace.
You need to grant all organizational users read access to a dashboard and several reports.
Solution: You create an Azure Active Directory group that contains all the users. You share each report and dashboard to the group.
Does this meet the goal?
A. Yes
B. No
You have five sales regions. Each region is assigned a single salesperson.
You have an imported dataset that has a dynamic row-level security (RLS) role named Sales. The Sales role filters sales transaction data by salesperson.
Salespeople must see only the data from their region.
You publish the dataset to powerbi.com, set RLS role membership, and distribute the dataset and related reports to the salespeople.
A salesperson reports that she believes she should see more data.
You need to verify what data the salesperson currently sees.
What should you do?
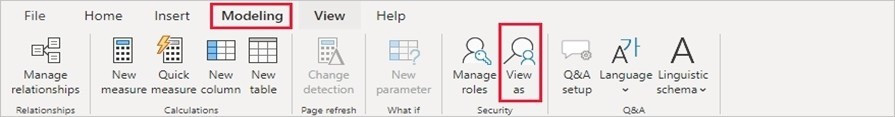
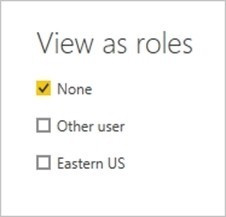
A. Use the Test as role option to view data as the salesperson's user account.
B. Use the Test as role option to view data as the Sales role.
C. Instruct the salesperson to open the report in Microsoft Power Bl Desktop.
D. Filter the data in the reports to match the intended logic in the filter on the sales transaction table.
You have a Power BI report. The report contains visualizations that have interactions. You need to identify which visualizations take the longest to complete. What should you use?
A. SQL Server Profiler
B. Performance Analyzer in Power BI Desktop
C. Query Diagnostics in Power BI
D. Microsoft Edge DevTools
You have a data model that contains many complex DAX expressions. The expressions contain frequent references to the RELATED and RELATEDTABLE functions.
You need to recommend a solution to minimize the use of the RELATED and RELATEDTABLE functions.
What should you recommend?
A. Merge tables by using Power Query.
B. Hide unused columns in the model.
C. Split the model into multiple models.
D. Transpose.
You have sales data in a star schema that contains four tables named Sales, Customer, Date, and Product.
The Sales table contains purchase and ship dates.
Most often, you will use the purchase date to analyze the data, but you will analyze the data by both dates independently and together.
You need to design an imported dataset to support the analysis. The solution must minimize the model size and the number of queries against the data source.
Which data modeling design should you use?
A. Use the Auto Date/Time functionality in Microsoft Power BI and do NOT import the Date table.
B. Duplicate the Date query in Power Query and use active relationships between both Date tables.
C. On the Date table, use a reference query in Power Query and create active relationships between Sales and both Date tables in the modeling view.
D. Create an active relationship between Sales and Date for the purchase date and an inactive relationship for the ship date.
You need to create a Power BI theme that will be used in multiple reports. The theme will include corporate branding for font size, color, and bar chart formatting. What should you do?
A. From Power Bl Desktop, customize the current theme,
B. From power Bl Desktop, use a built in report theme.
C. Create a theme as a JSON file and import the theme into Power Bl Desktop.
D. Create a theme as a PBIVlZ file and import the theme into Power Bl Desktop.
A business intelligence (Bl) developer creates a dataflow in Power Bl that uses DirectQuery to access tables from an on premises Microsoft SQL server. The Enhanced Dataflows Compute Engine is turned on for the dataflow. You need to use the dataflow in a report. The solution must meet the following requirements:
1.
Minimize online processing operations.
2.
Minimize calculation times and render times for visuals.
3.
include data from the current year, up to and including the previous day. What should you do?
A. Create a dataflows connection that has Import mode selected and schedule a dairy refresh.
B. Create a dataflows connection that has DirectQuery mode selected.
C. Create a dataflows connection that has DirectQuery mode selected and configure a gateway connection for the dataset
D. Create a dataflows connection that has Import mode selected and create a Microsoft Power Automate solution to refresh the data hourly.
Note: This question is part of a series of questions that present the same scenario. Each question in the series contains a unique solution that might meet the stated goals. Some question sets might have more than one correct solution, while
others might not have a correct solution.
After you answer a question in this section, you will NOT be able to return to it. As a result, these questions will not appear in the review screen.
You have a Microsoft Excel workbook that is saved to Microsoft SharePoint Online. The workbook contains several Power View sheets.
You need to recreate the Power View sheets as reports in the Power Bl service.
Solution: From the Power Bl service, get the data from SharePoint Online, and then click Connect
Does this meet the goal?
A. Yes
B. No
You have the following table named Location.
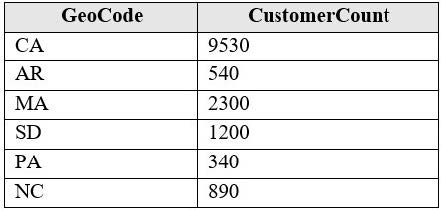
The GeoCode column represents the country where each customer is located.
You create a map visualization as shown in the exhibit. (Click the Exhibit tab.)
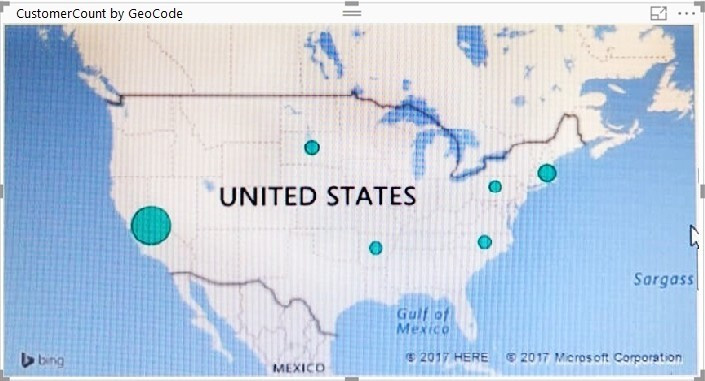
You need to ensure that the map displays the country locations. What should you do?
A. Replace the values in the GeoCode column with postal codes or zip codes.
B. Change the name of the GeoCode column to Country.
C. Change the name of the Location table to Country.
D. Change the Default Summarization of the GeoCode column.
E. Add a Geoportal column to the Location table.
F. Change the Data Type of the GeoCode column.
HOTSPOT
You have two tables named Customers and Invoice in a Power BI model. The Customers table contains the following fields:
1.
CustomerID
2.
Customer City
3.
Customer State
4.
Customer Name
5.
Customer Address 1
6.
Customer Address 2
7.
Customer Postal Code
The Invoice table contains the following fields:
1.
Order ID
2.
Invoice ID
3.
Invoice Date
4.
Customer ID
5.
Total Amount
6.
Total Item Count
The Customers table is related to the Invoice table through the Customer ID columns. A customer can have many invoices within one month.
The Power BI model must provide the following information:
The number of customers invoiced in each state last month
The average invoice amount per customer in each postal code
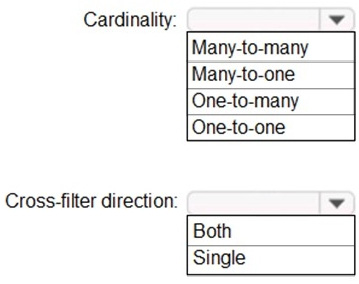
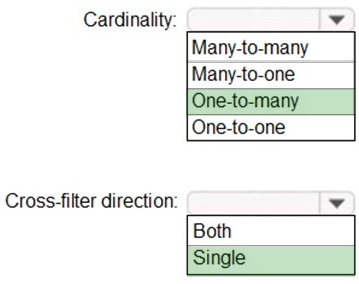
You need to define the relationship from the Customers table to the Invoice table. The solution must optimize query performance.
What should you configure? To answer, select the appropriate options in the answer area.
NOTE: Each correct selection is worth one point.
Hot Area:
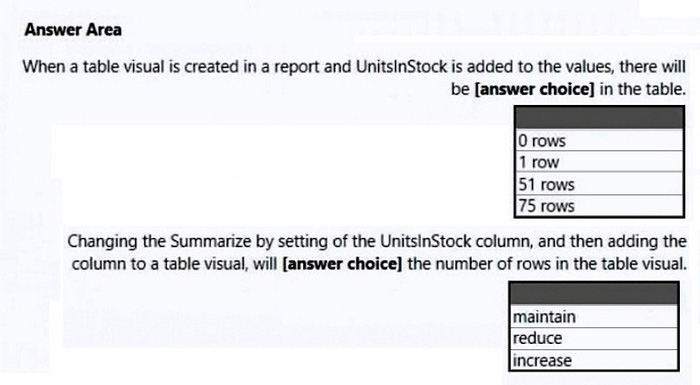
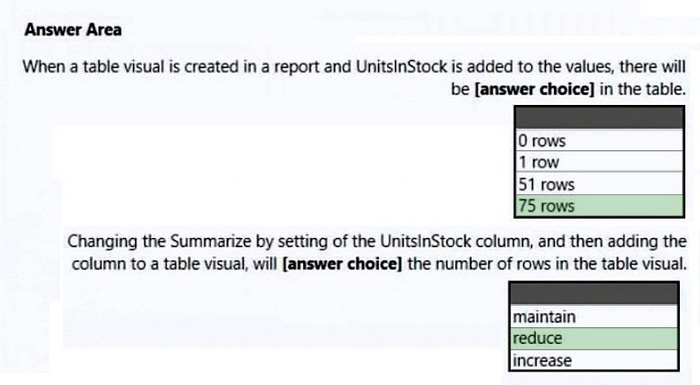
HOTSPOT
You have a column named UnitslnStock as shown in the following exhibit
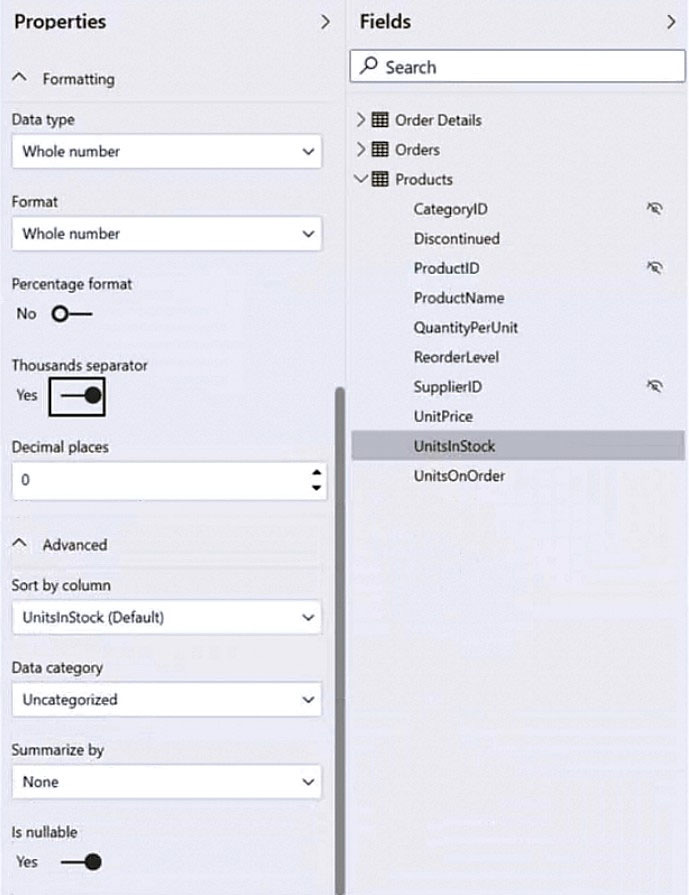
UnitsInStock has 75 non-null values, of which 51 are unique.
Use the drop-down menus to select the answer choice that completes each statement based on the information presented in the graphic.
NOTE: Each correct selection is worth one point.
Hot Area:
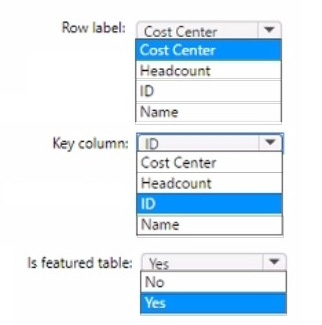
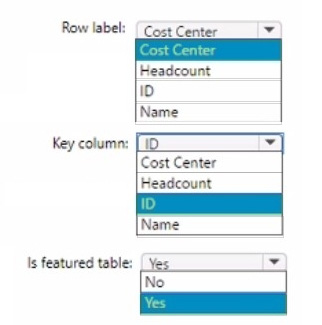
HOTSPOT
You create a Power Bl dataset that contains the table shown in the following exhibit.
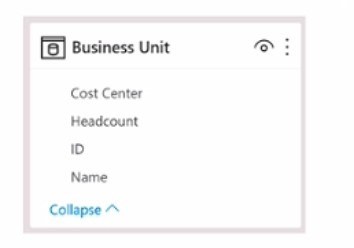
You need to make the table available as an organizational data type In Microsoft Excel.
How should you configure the properties of the table? To answer select the appropriate options in the answer area.
NOTE: Each correct selection is worth one point.
Hot Area:
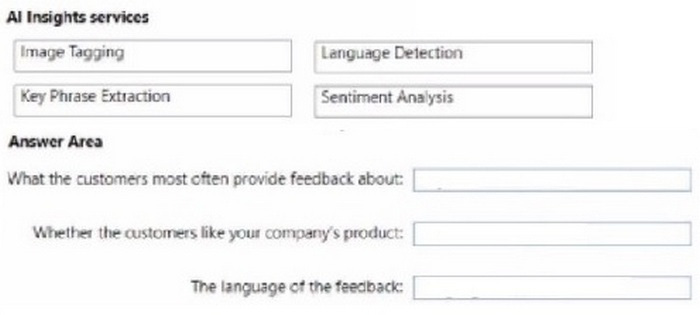
DRAG DROP
You use Power Query Editor to preview customer feedback data.
You need to use Al Insights to add a column of enhanced data based on the customer feedback. The solution must identify the following:
1.
What the customers most often provide feedback about
2.
Whether the customers like your company's product
3.
The language of the feedback
Which Al Insights service should you use for each output? To answer, drag the appropriate services to the correct outputs. Each service may be used once, more than once. or not at all. You may need to drag the split bar between panes or
scroll to view content.
NOTE: Each correct selection is worth one point.
Select and Place:

Why select/choose certbus.com?
Millions of interested professionals can touch the destination of success in exams by certbus.com. products which would be available, affordable, updated and of really best quality to overcome the difficulties of any course outlines. Questions and Answers material is updated in highly outclass manner on regular basis and material is released periodically and is available in testing centers with whom we are maintaining our relationship to get latest material.
![]()
![]()
Copyright © 2004-2025 certbus.com, All Rights Reserved.