TDS-C01 Online Practice Questions and Answers
What are three reasons to use joins instead of relationships? (Choose three.)
A. You need to use a specific join type.
B. You need to create an extract that will have multiple tables.
C. You need to use row-level security.
D. You need to use a data model that supports shared dimensions.
E. You need to connect to multiple databases.
In which situation should you save a workbook as a PDF document?
A. Your users have Tableau Desktop but not Tableau Reader.
B. You want document users to be able to filter and sort the views.
C. Your analysis does not require a live connection to a data source.
D. You need paper copies of the workbook.
Which two statements accurately describes measures? (Choose two.)
A. They affect the level of detail in the view
B. They contain qualitative values
C. They can be continuous or discrete
D. They contain numeric, quantitative values
You create a visualization by first adding a measure to rows. Next, you add a dimension with 11 members to columns.
Assuming that all the dimensions have a non-zero value how many marks are in the view before and after the dimension is added?
A. 1 before and 12 after
B. 1 before and 11 after
C. 2 before and 11 after
D. 1 before and 2 after
What allows you to drill up or down in the level of detail (LOD)?
A. Sets
B. Bins
C. Groups
D. Hierarchies
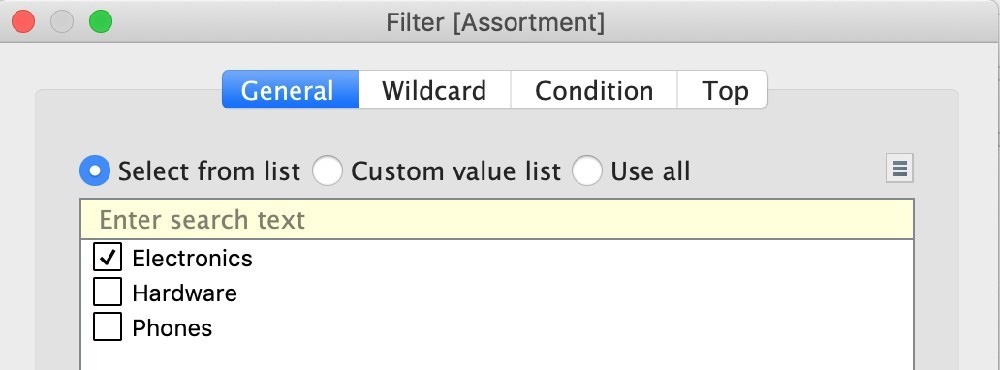
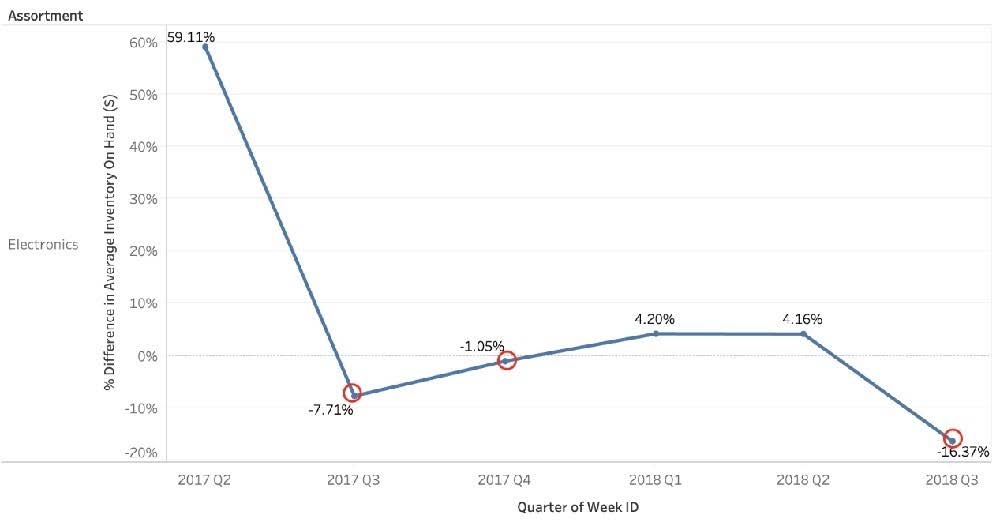
Using the Time Series table, create a chart that shows the percent difference in Average Inventory on Hand for each Assortment by year and quarter. How many quarters did the Electronics Assortment show a negative percent difference in the Average Inventory On Hand?
A. 1
B. 2
C. 3
D. 4
Using the atheletes table:
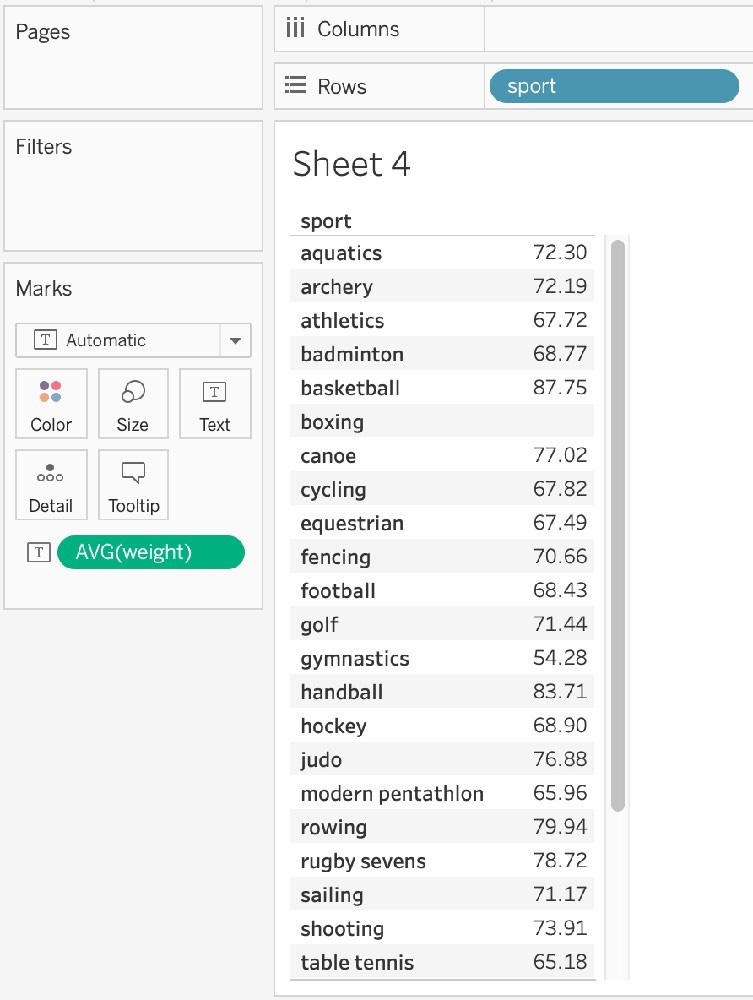
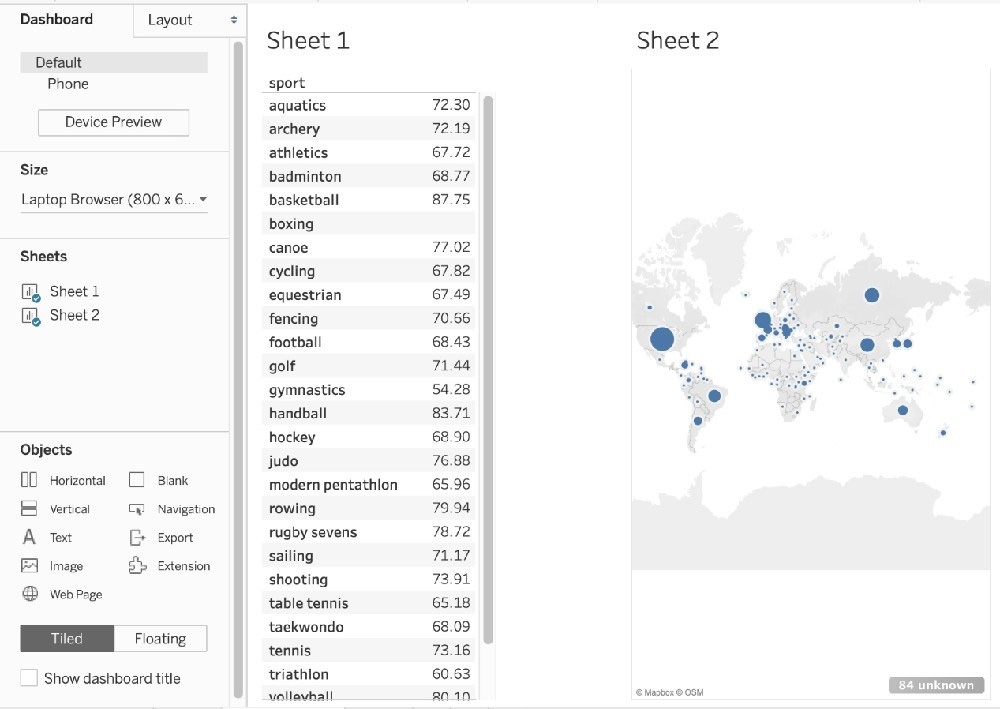
i) Create a sheet with a crosstab showing the Average weight for each sport (Sheet 1)
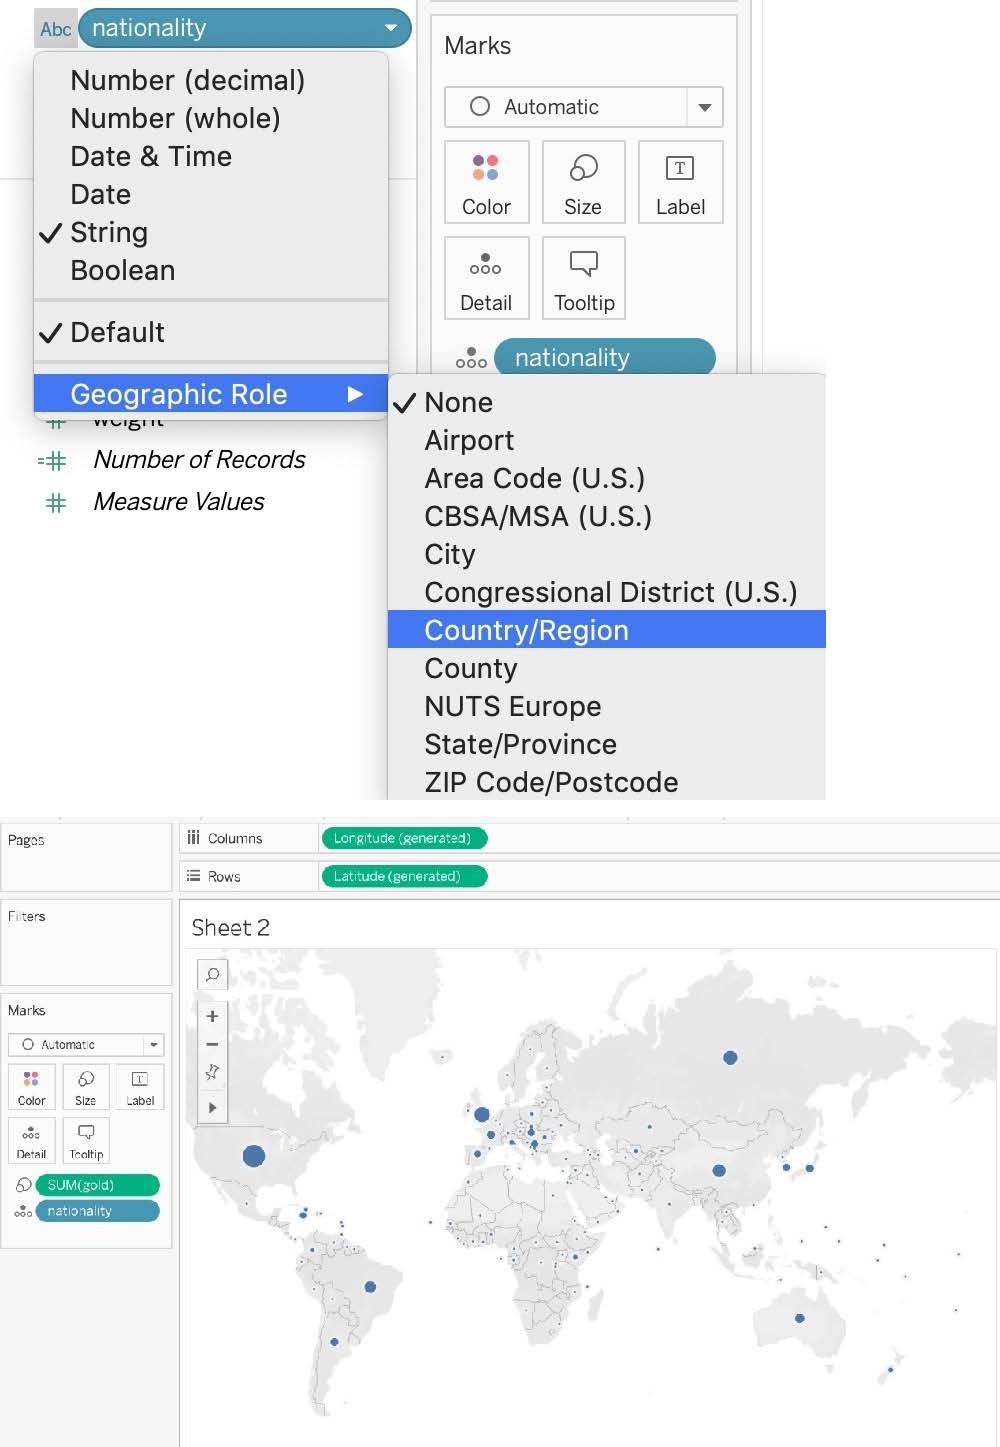
ii) Create a sheet with a Map showing the Total number of gold medals per Country. Use size as a Mark. (Sheet 2)
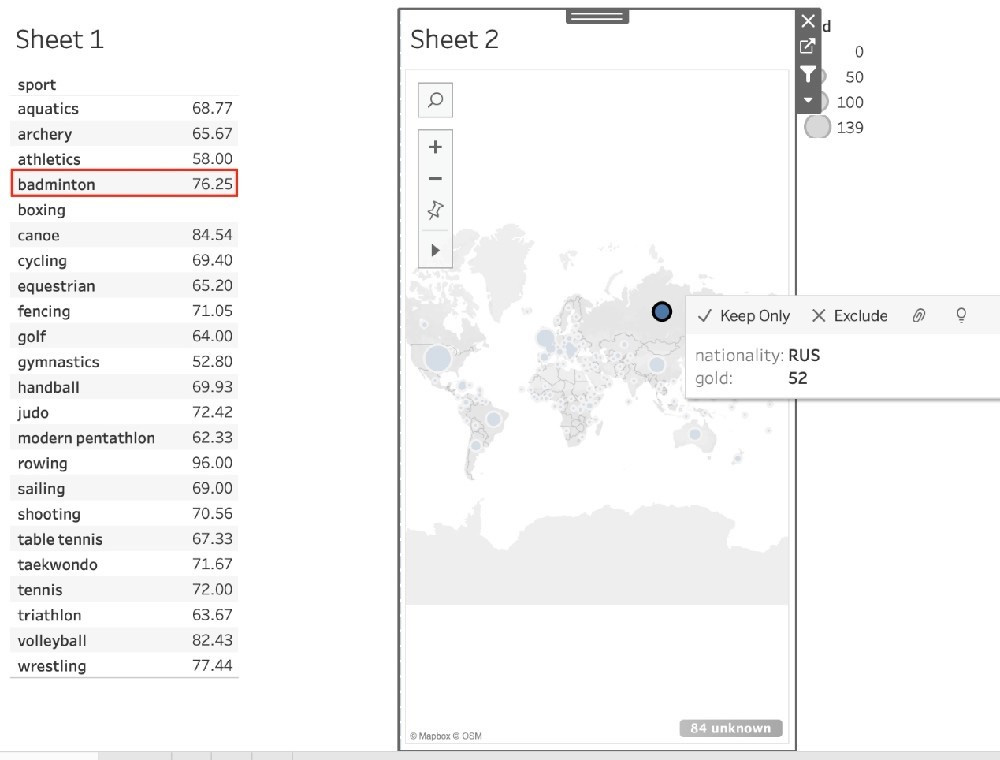
Now, Create a Dashboard containing both these sheets, and Use Sheet 2 as a Filter for Sheet 1. What was the average weight for Badminton in Russia?
(Ignore any nulls / unknowns)
A. 76.25
B. 65.67
C. 68.77
D. 4.87
For which of the following charts, does the Size option on the Marks card not work?
A. Gantt Chart
B. Bar Chart
C. Tree Map
D. Pie Chart
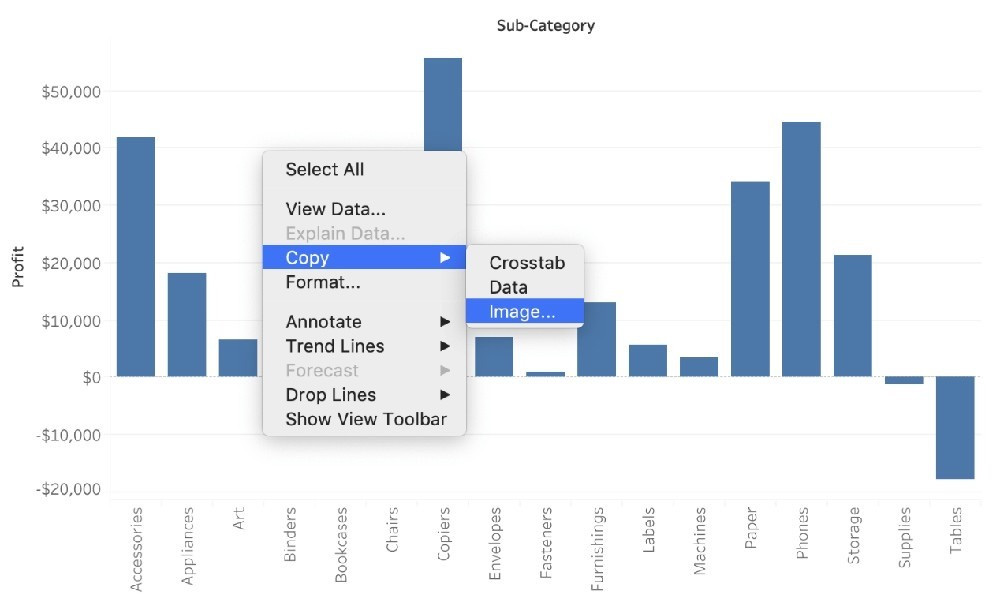
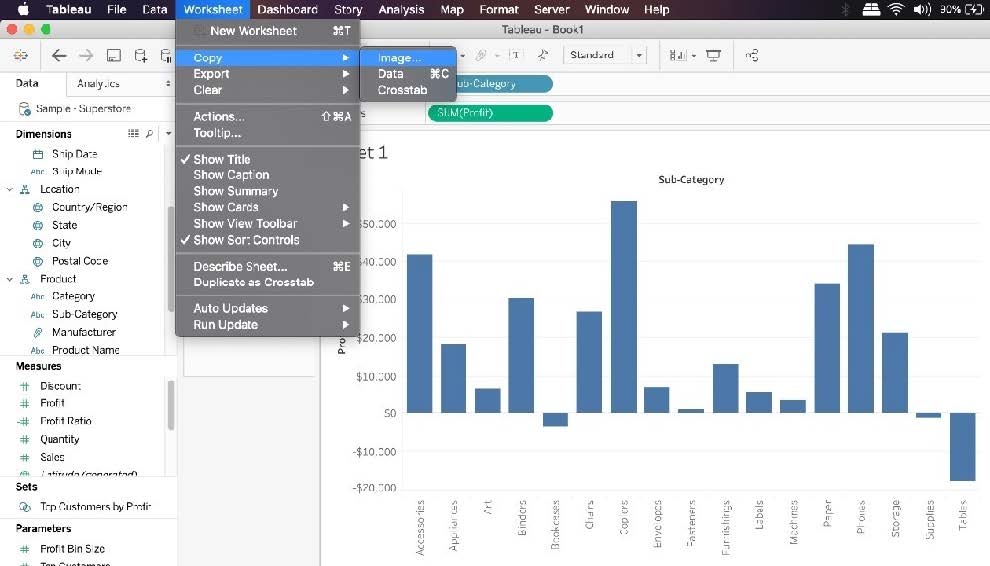
Which of the following are valid ways to copy a worksheet visualisation as an image?
A. By simply clicking Control + V on the keyboard
B. By clicking on Worksheet in the Tableau Main Menu above, and choosing Copy->Image
C. Using the Marks shelf and choosing Copy->Image
D. By right clicking on the worksheet visualisation and selecting Copy->Image
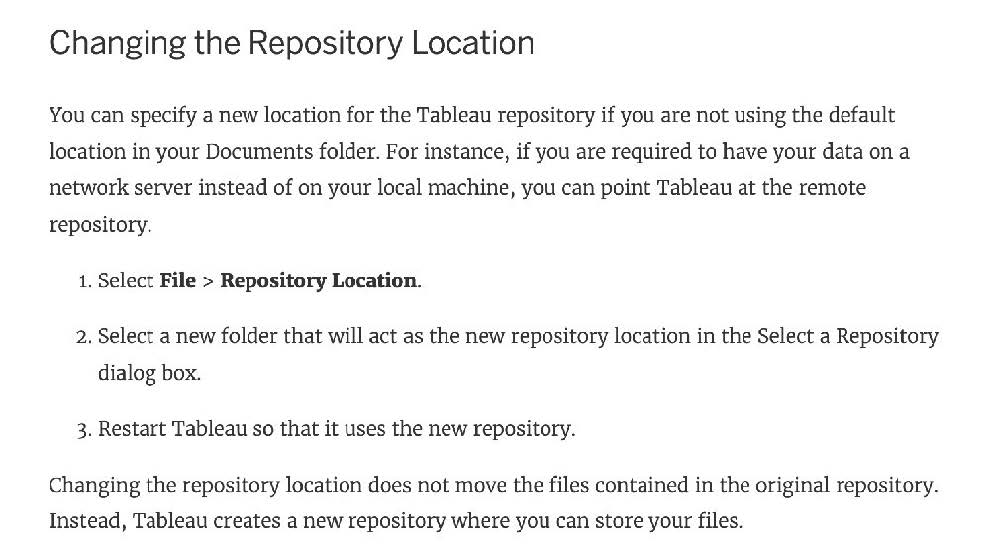
How can you change the default Tableau repository location?
A. By clicking on Window-> Repository Location
B. By clicking on Help-> Change Repository Location
C. By clicking on File-> Repository Location and choosing a new location
D. By Moving the repository location manually to wherever we want
What is this view referred to as in Tableau?
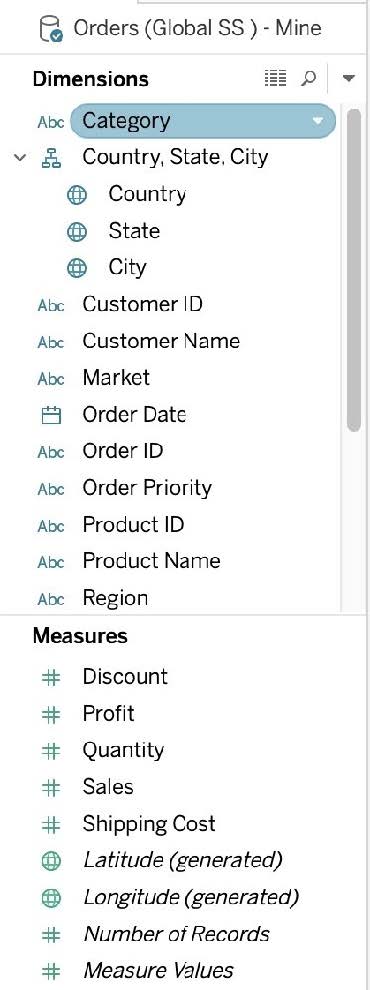
A. Analytics Pane
B. Window Pane
C. Data Pane
D. Dimensions and Measures
The default path for all supporting files, data sources, icons, logs etc is in ______________________
A. Documents-> Tableau Files
B. Documents-> Tableau
C. Documents-> My Tableau Repository
D. Downloads-> Tableau Support Files
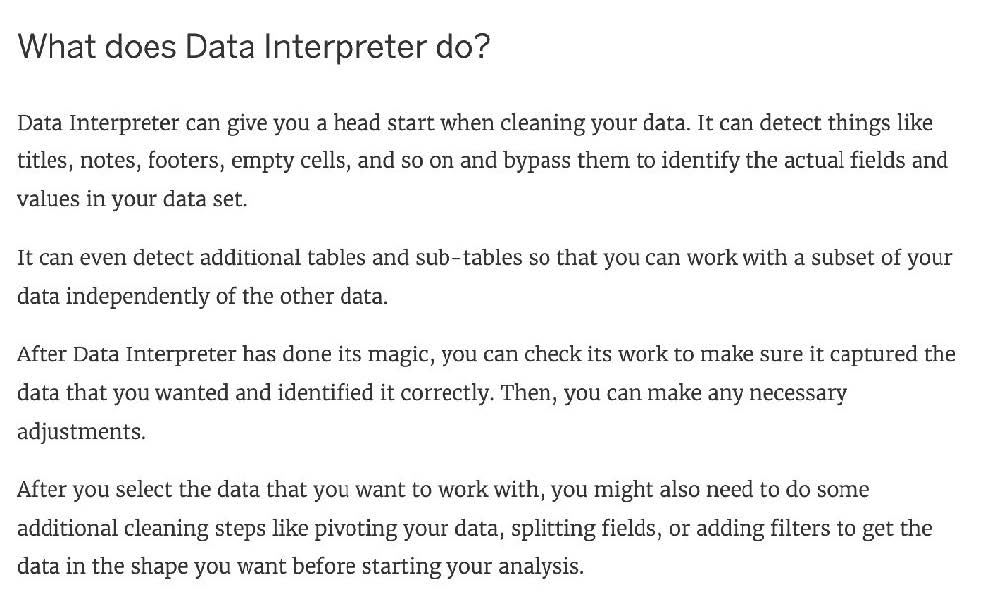
You can use the __________________ in Tableau to clean / organise your data.
A. Data cleaner
B. Data manager
C. Data interpreter
D. Data organiser
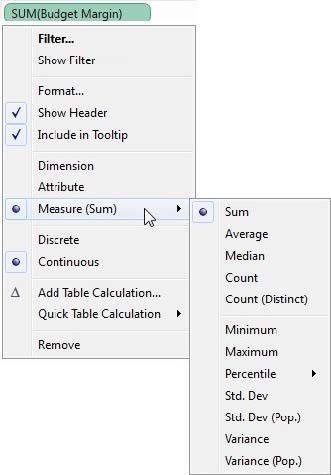
How does Tableau know at which level to aggregate values?
A. Values are always aggregated at the level of granularity of the worksheet.
B. Tableau doesn't aggregate values, we do!
C. Values are always aggregated at the level of the Date Part
D. Aggregation is always done by using Tableau special formulas
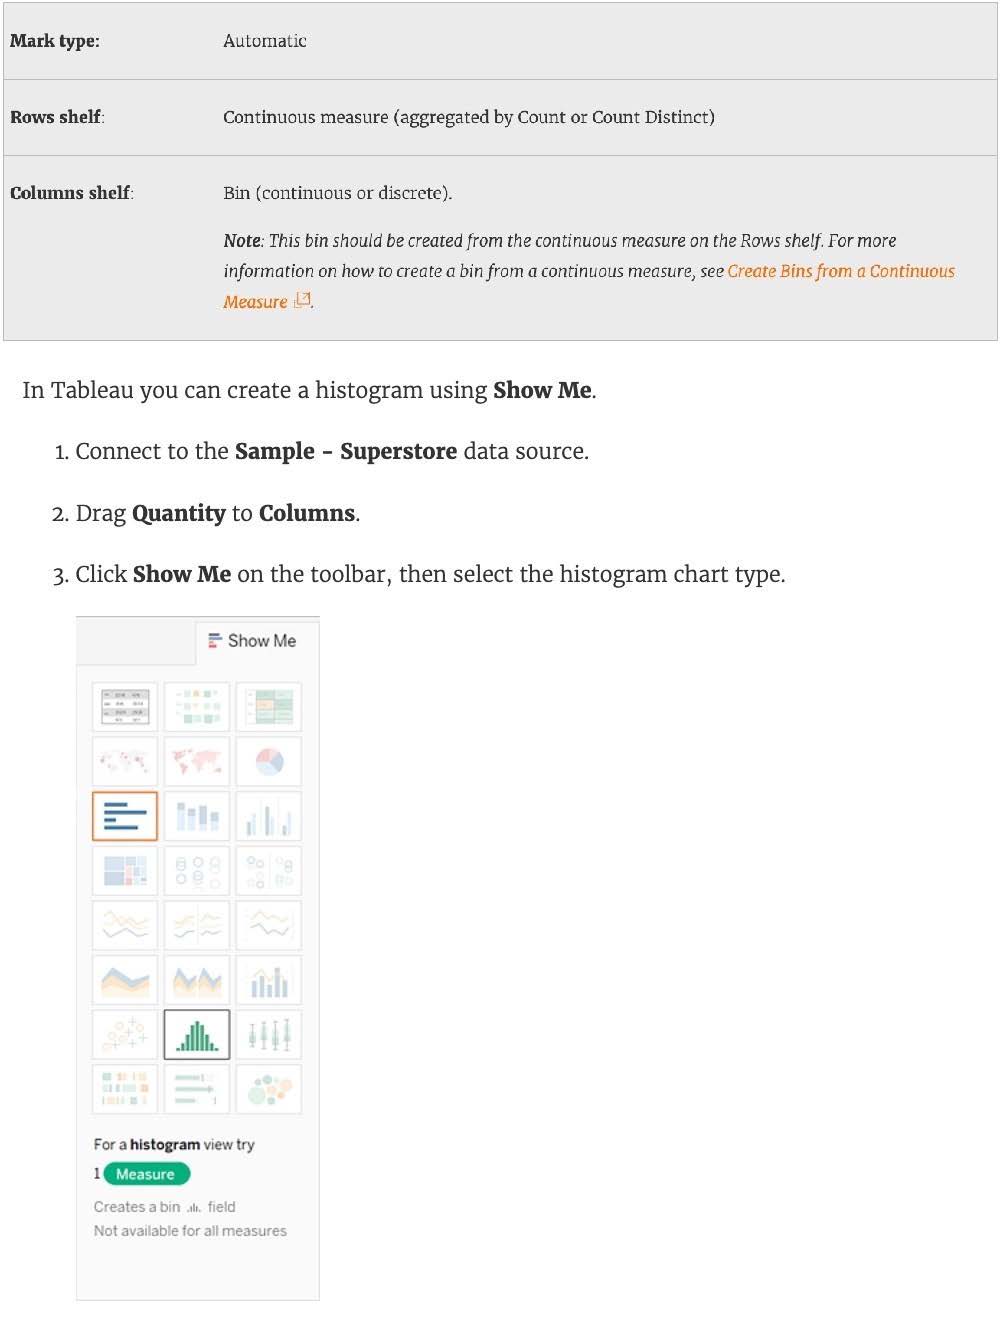
Which of the following can you use to create a Histogram?
A. 2 measures
B. 1 measure
C. 2 dimensions
D. 1 dimension

