TDA-C01 Online Practice Questions and Answers
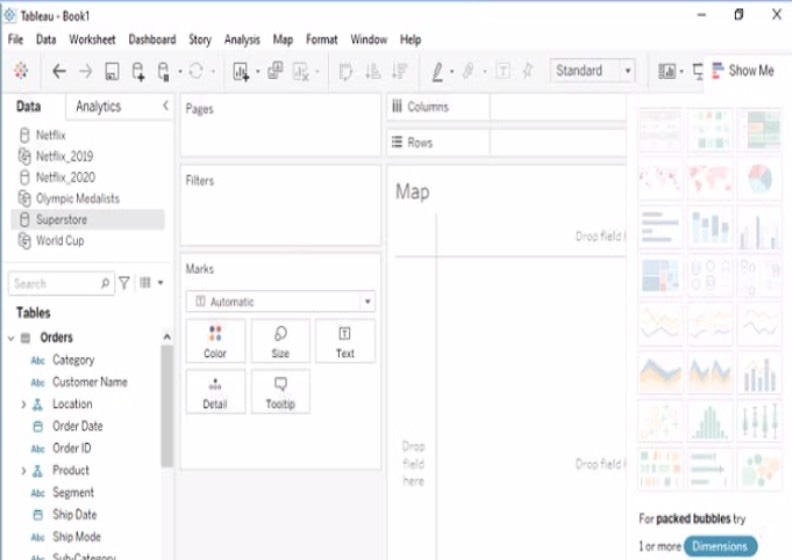
You want to connect a Tableau workbook to a dataset in a Microsoft Excel spreadsheet. What should you do from Tableau Desktop?
A. From the Data menu select New Data Source
B. From the Data menu select Replace Data Source
C. From the File menu select Import Workbook
D. From the File menu select New
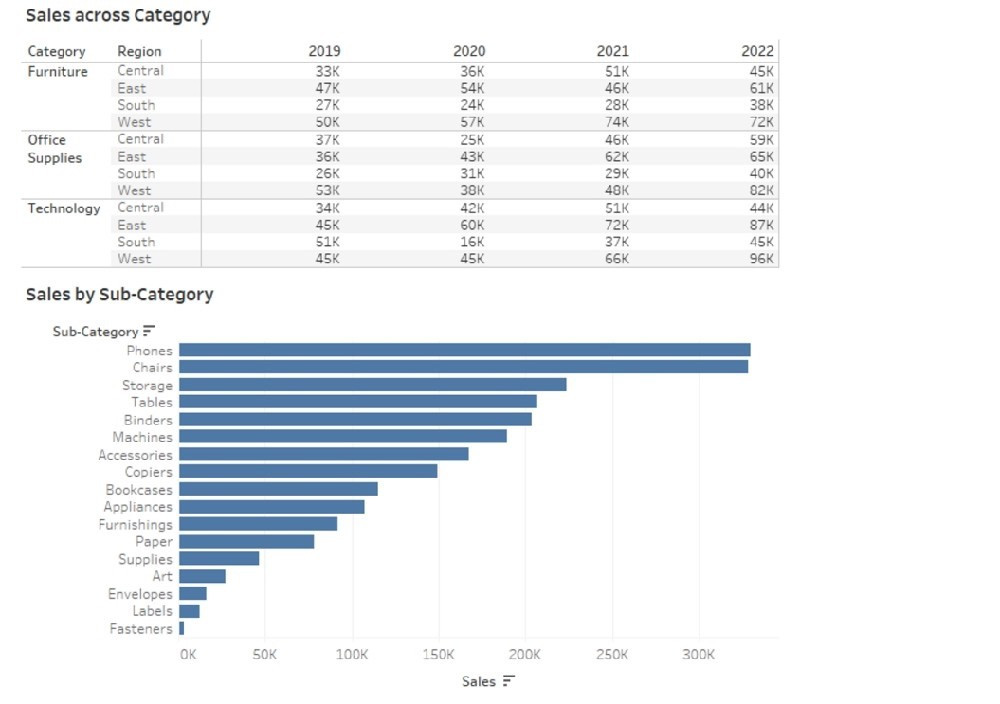
You have the following dataset.
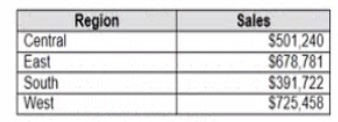
Which Level of Detail (LOD) expression should you use to calculate tie grand total of all the regions?
A. {FIXED: [Region] SUM Sales}
B. {FIXED: SUM Sales}
C. {Fixed: [Region]: TOTAL Sales}
D. {FIXED: TOTAL (Sales)}
A colleague provides you with access to a folder that contains the following files:
Sates.csv Bookl.twb Sates.hyper Export.mdb
Which He contains an extract?
A. Export mdb
B. Book1.twb
C. Sales.hyper
D. Sales.csv
You have the following dataset.
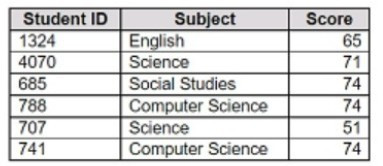
You want to create a new calculated dimension field named Category that meets the following conditions:
When Subject is Computer Science or Science, Category must be Sciences. When Subject is English or Social Studies, Category must be Humanities.
Which two logical functions achieve the goal? Choose two.
A. IF [Subject]- 'Science' THEN 'Sciences' ELSEIF [Subject]='English' THEN 'Humanities' ELSEIF [Subject]-'Social Studies' THEN 'Humanities' ELSEIF [Subject]= 'Computer Science' THEN 'Sciences' END
B. IIF(( CONTAINS ([Subject], 'Science') = TRUE) , 'Humanities', 'Sciences')
C. IF ENDSWITH ( [Subject], 'Computer Science') THEN 'Sciences' ELSE 'Humanities' END
D. CASE [Subject] WHEN 'Computer Science' THEN 'Sciences' WHEN 'Science' THEN 'Sciences' WHEN 'English' THEN 'Humanities' WHEN 'Social Studies' THEN 'Humanities' End
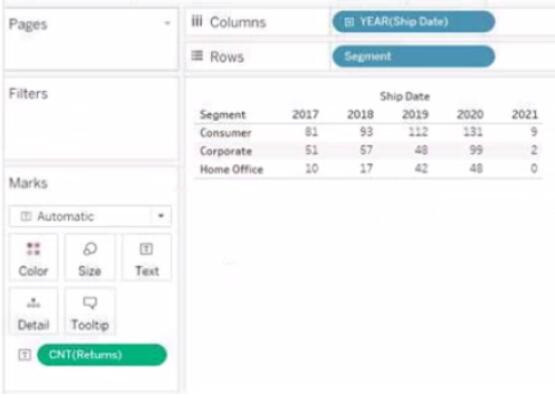
You have the following map.
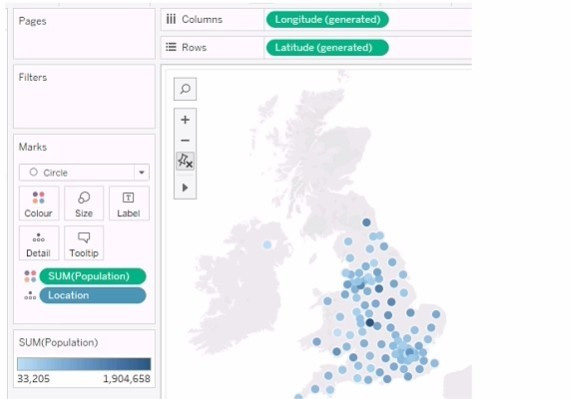
You need the map to appear as shown in the following visualization.
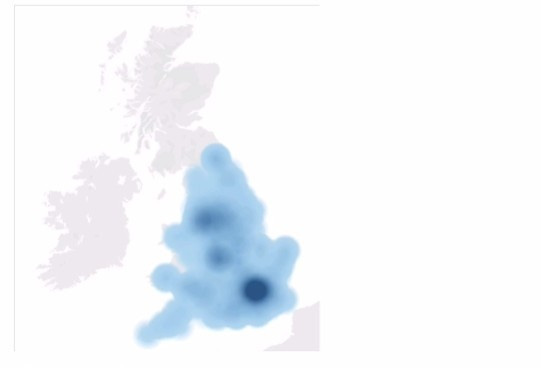
What should you do?
A. Change the mark type to Density
B. Drag Location to Size on the Marks card
C. Change the mark type to Map
D. Drag Population to Size on the Marks card
E. Change the opacity to 75%
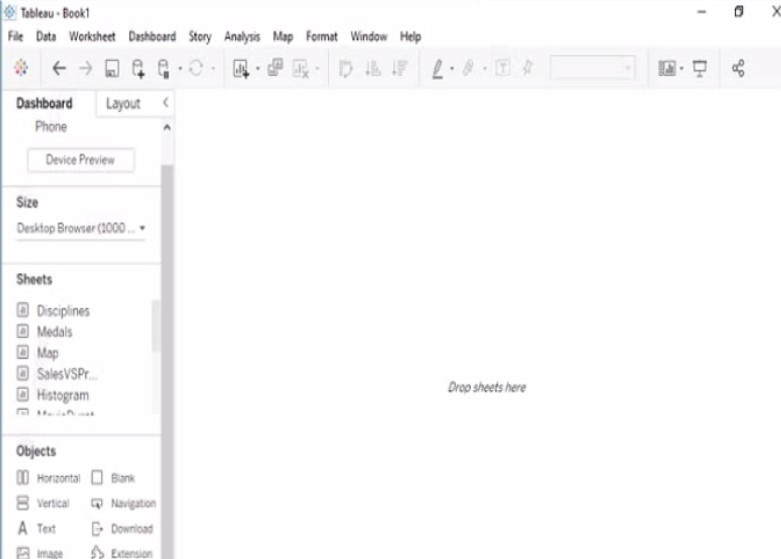
You are creating a new dashboard.
You need to add a button to the dashboard that allows users to export the dashboard as an image.
Which type of object should you use?
A. Image
B. Ask Data
C. Extension
D. Download
E. Navigation
You want to create the following dashboard.
The dashboard will contain two sheets that will connect to the same data source. The top sheet will be configured to filter the bottom sheet. When you click a category on the top sheet, the sheets must resize as shown in the following exhibit.
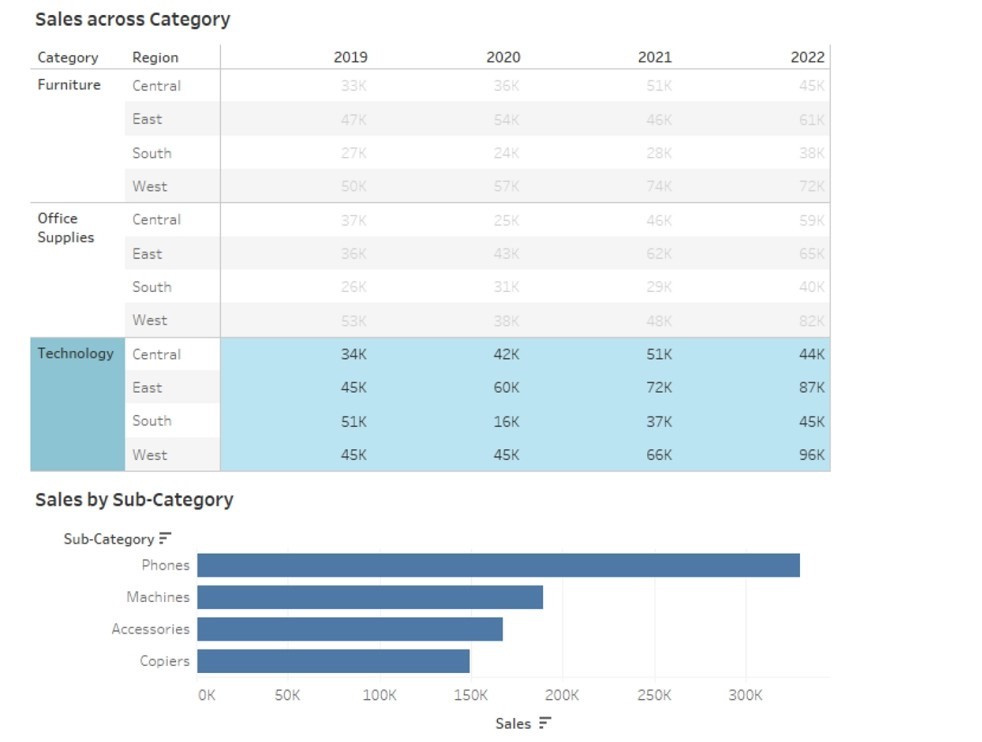
How should you lay out the objects on the dashboard?
A. Drag a horizontal container to the dashboard and add both sheets to the container. Set the Fit to Standard.
B. Add both sheets to the dashboard. Set Fit to Fix width.
C. Drag a blank object to the dashboard and add both sheets to the dashboard. Set Fit to Entire view.
D. Drag a vertical container to the dashboard and add both sheets to the container. Set Fit to Entire view.
CORRECT TEXT
Open the link to Book1 found on the desktop. Open the sales dashboard.
Add the Sales by State sheet in a Show/Hide button to the right side of the dashboard.
A. Check the steps below in explanation.
CORRECT TEXT
Open the Link to Book1 found on the desktop. Open Map worksheet and use Superstore data source.
Create a filed map to show the distribution of total Sales by State across the United States.
A. Check the steps below in explanation.
CORRECT TEXT
Open the link to Book1 found on the desktop. Open Disciplines worksheet.
Filter the table to show the members of the Top10 set and the members of the Bottom10 set. There should be a total of 20 rows.

A. Check the steps below in explanation.
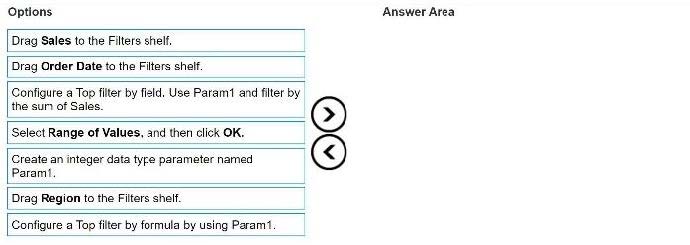
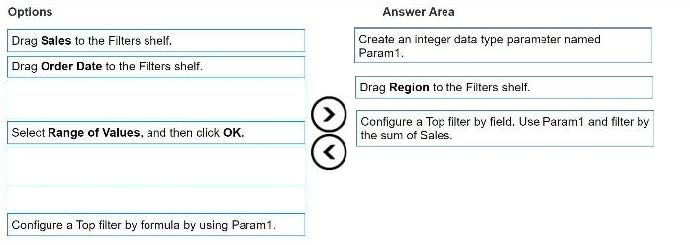
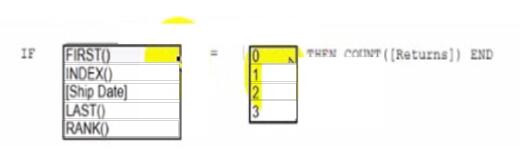
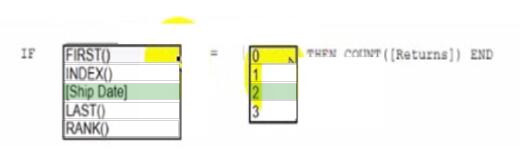
DRAG DROP
You have a data source that contains the following columns.
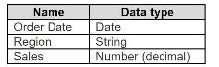
You want to filter regions based on the highest sales. Users must be able to specify the number of regions shown.
Which three actions should you perform in order? (Place the three correct options in order.
Use the arrows to move Options to Answer Area.
Use Answer Area arrows to re-order the options.)
Select and Place:
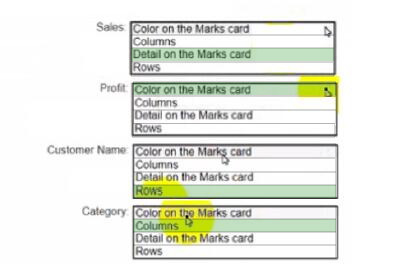
You have a dataset that has four fields named Category. Profit Sates and Customer Name. You need to create the following visualization.
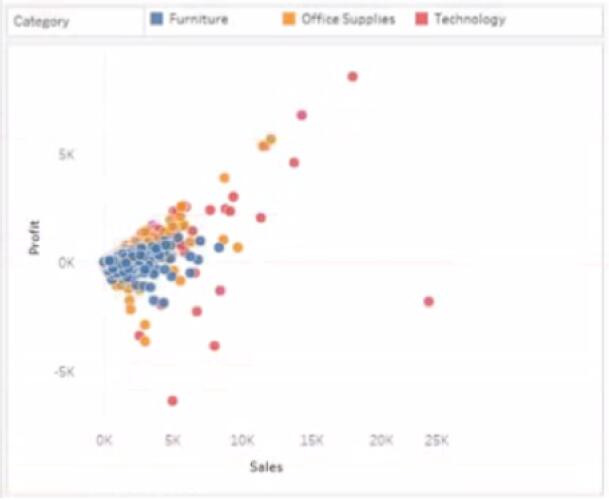
Hot Area:
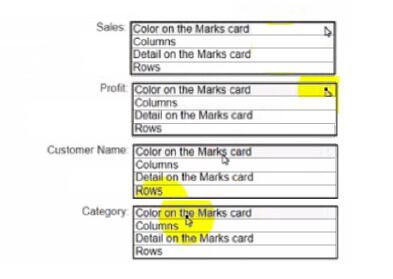
HOTSPOT
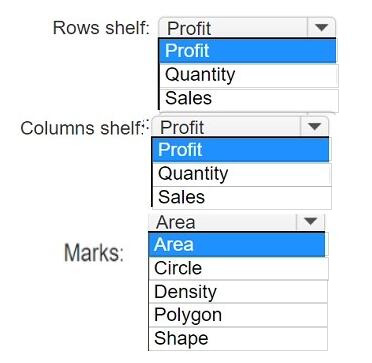
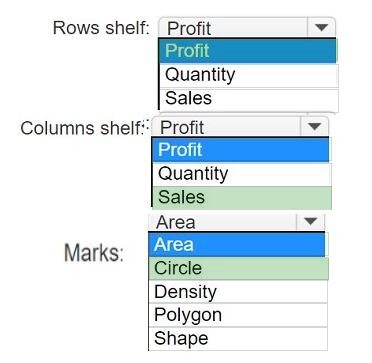
You have a data set that contains three columns named Sales, Profit, and Quantity.
You need to build the following scatter plot.
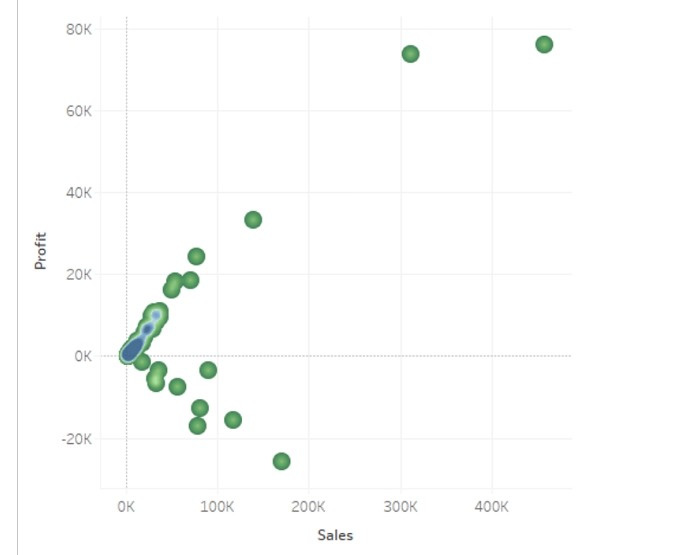
Hot Area:
HOTSPOT
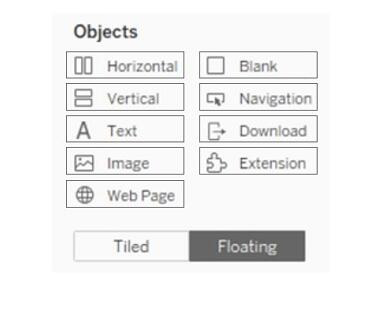
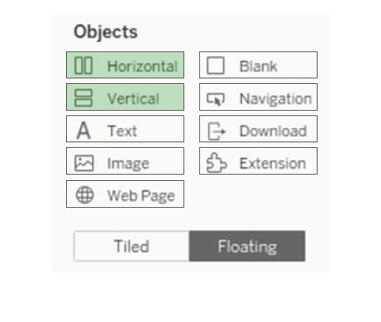
You have a blank dashboard.
You want to add two sheets to the dashboard. The sheets must support the Show/Hide button.
To which two objects can you add the sheets? (Click the two appropriate Options in the Answer Area.)
Hot Area:
Why select/choose certbus.com?
Millions of interested professionals can touch the destination of success in exams by certbus.com. products which would be available, affordable, updated and of really best quality to overcome the difficulties of any course outlines. Questions and Answers material is updated in highly outclass manner on regular basis and material is released periodically and is available in testing centers with whom we are maintaining our relationship to get latest material.
![]()
![]()
Copyright © 2004-2025 certbus.com, All Rights Reserved.