QSDA2022 Online Practice Questions and Answers

Refer to the exhibit
A data architect is working on an app that contains orders, invoices, and shipping data. There are three different date fields within the data:
*
OrderDate
*
InvoiceDate
*
ShippingDate
The business analyst needs to replicate the chart above to show Order and Shipping amounts on the same Month axis.
What should the data architect do?
A.
Create a Month field for each of the three dates in the fact table and use that in the chart
B.
Load the key field and the three date fields into a concatenated bridge table that contains KeyField and Date
C.
Left Join the three date fields onto one bridge table using the key field containing KeyField and Date
Refer to the exhibit.
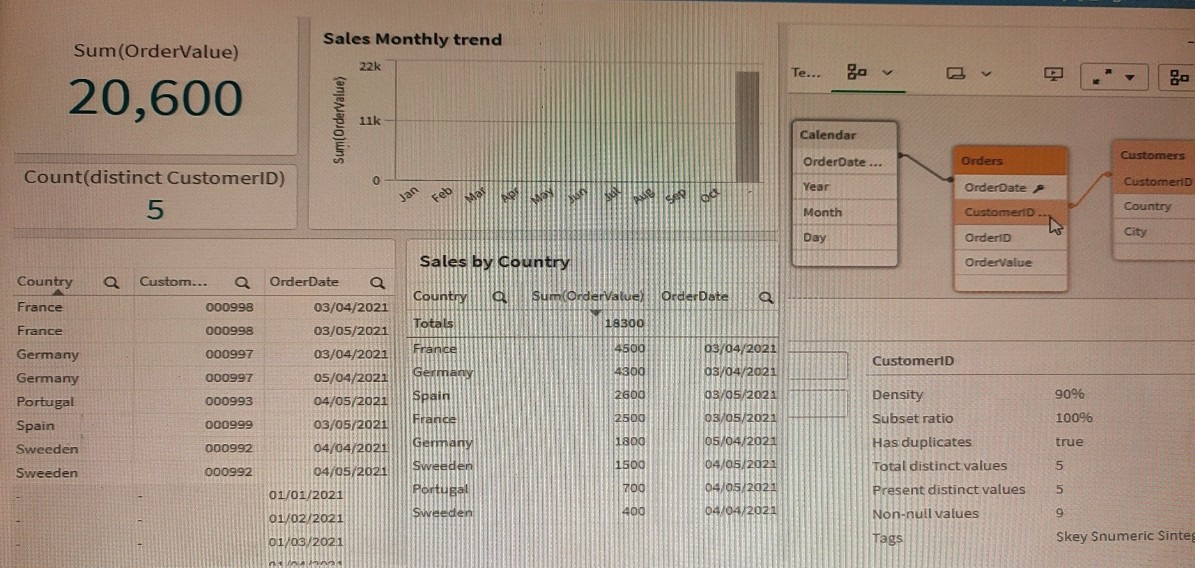
A data architect is working with an app and creates some visualizations to check the data. Some visualizations show issues in the data set.
*
The Sales by Country table shows a total OrderValue of 18,300 sales while the KPI shows a total OrderValue of 20,600.
*
The Sales monthly trend bar chart does not work with the Month field. Which two data issues should the data architect fix in the app? (Select two.)
A.
The Month field does not exist in the Orders table and needs to be incorporated in the table using he Calendar table.
B.
In the Orders table, some CustomerlD values are null because there are orders with no customer and needs to be incorporated in the table using the Calendar table, null because there are orders with no customer
C.
In the Orders table, some values in the CustomerlD field do not exist in the Customers table.
D.
The OrderDate field values in the Calendar table do not match with the values in the OrderDate field from the Orders table
A data architect needs to upload different data sources. To properly handle null values, the data architect decides to set all of these values to "Missing Value". Which syntax should the data architect use?
A. NullAsValue*; Set NullValues = 'Missing Value';
B. NullasNull *; Set NullValues = 'Missing Value';
C. NullasNull *; Set NullValue = 'Missing Value';
D. NullAsValue*; Set NullValue = 'Missing Value';
Refer to the exhibit.
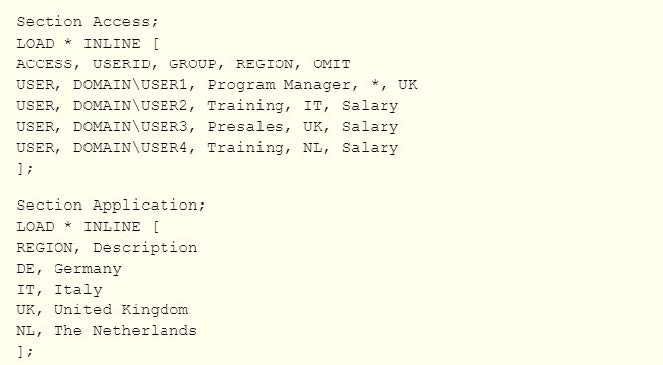
USER1 has an app protected using this Section Access statement. Which countries can USER1 see in the app''
A. Germany. Italy, United Kingdom, The Netherlands
B. Italy, The Netherlands
C. Italy, United Kingdom, The Netherlands
D. Germany Italy, The Netherlands
Refer to the exhibits.
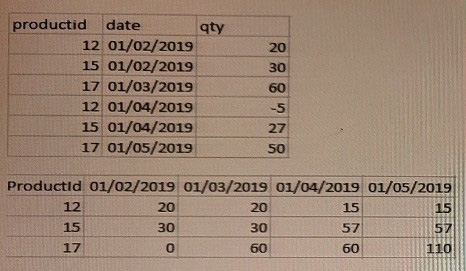
The first table shows the source table (Original table).
This data represents the stocks stored every month for each product:
The relevant fields are productid, qty, and date.
The date field represents the calendar months using
The qty field shows the product stock fluctuation from the current month versus the previous month. If there is no fluctuation between months, there are no new entries in the table.
The second table shows a Pivot table visualization the data analyst needs to create in the app displaying per each product the monthly trend of available stock.
For performance reasons, the data analyst requests the data architect to calculate the running stock quantity of each product for every month in the script.
Which approach should the data architect use?
A. 1. Generate a Cartesian JOIN between productid and date in a Combined table
2.
RIGHT JOIN the Combined table with the Original table to populate the missing qty values
3.
Use PREVIOUS() and RANGESUMQ functions to create the running quantity totals for each product for every month
B. 1. Generate a Cartesian JOIN between productid and date in a Combined table
2.
LEFT JOIN the Combined table with the Original table to populate the missing qty values
3.
Use PREVIOUSO and SUM() functions to create the running quantity totals for each product for every month
C. 1. Generate a Calendar table with all dates between the minimum and maximum date values in an Original table
2.
RIGHT JOIN the Calendar table back to the Original table to populate the missing qty values
3.
Use PEEK() and RANGECOUNTO functions to create the running quantity totals for each product for every month
D. 1 Generate a Calendar table with all dates between the minimum and maximum date values in an Original table
2. LEFT JOIN the Calendar table back to the Original table to populate the missing qty values
Refer to the exhibits.
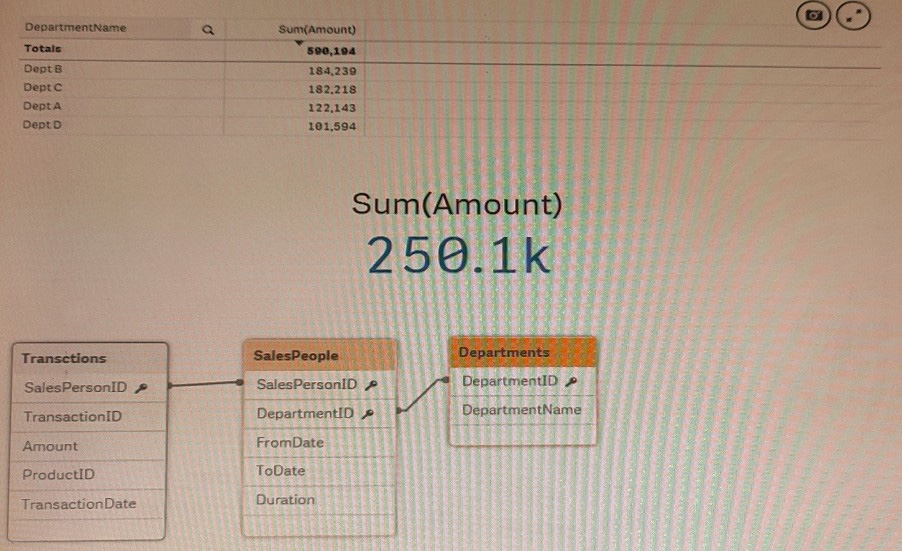
An app is built to analyze salesperson performance by department. Departments are unique within the Departments table, but Salespeople often move between departments. A strict business rule states that a salesperson must be associated
with ONLY one department at all times.
The data architect creates a summary of department performance and notices the values are incorrect. The total sales KPI shows the correct result.
How should the data architect modify the data model to correct this issue?
A. Create a bridge table between the Departments and Salespeople tables to resolve the many-to-many relationship
B. Create a bridge table between the Transactions and Salespeople tables to resolve the many-to-many relationship
C. Join the Departments and Salespeople tables to resolve the many-to-many relationship
D. Join the Transactions and Salespeople tables to resolve the many-to-many relationship
A global retailer has a large database in which millions of sales transactions are added per hour.
Each regional sales manager should only see details for customers in their region. After filtering based on criteria such as region, gender, and income level, sales managers should be able to see the most current detailed transactions.
What should a data architect do to meet these requirements?
A. Create an app for each sales manager with Qlik GeoAnalytics
B. Use section access and include a service account in the table
C. Use On-Demand App Generation (ODAG) and section access
D. Use section access to restrict sales manager access by region
The Marketing department is using some similar KPIs in different apps that need to be modified frequently according to the business needs. The KPIs are created using master items with the same expression.
Which method should the data architect use to manage the modifications in all apps?
A. Create a variable repository and load them using INCLUDE statements in the apps where needed
B. Create a selection app with all the master items and use an on-demand app generation method.
C. Create a core app with all the master items needed and use a BINARY load in the other apps.
D. Create only a single app with all the master items needed and protect it with SECTION ACCESS.
A data architect needs to develop a script to export tables from a model based upon rules from an independent file. The structure of the text file with the export rules is as follows:

These rules govern which table in the model to export, what the target root filename should be, and the number of copies to export.
The TableToExport values are already verified to exist in the model.
In addition, the format will always be QVD, and the copies will be incrementally numbered.
For example, the Customer table would be exported as:
What is the minimum set of scripting strategies the data architect must use?
A. Two loops without any conditional statement
B. One loop and two IF statements
C. Two loops and one IF statement
D. One loop and one SELECT CASE statement
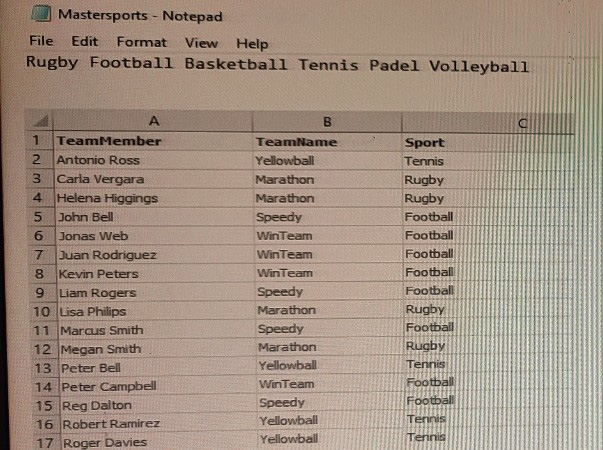
Refer to the exhibits.
The first table, Mastersports, contains the master list of all sport names that need to be loaded into the app. The second table, TeamMembers, contains the teams and team members registered for specific sports.
In a Qlik Sense app, a data architect is loading the two tables that need to be linked together based on the Sport field. The table format cannot be changed in the source.
What should the data architect do in the data load editor?
A. Apply a preceding LOAD from the TeamMembers table with the SUBFIELD function and rename the field to Sport
B. Apply a preceding LOAD to the MasterSports table with the SUBFIELD function to create the Sport field
C. Apply a FOR loop to load to the MasterSports table creating the values for the Sport field
A data architect of an organization that has implemented Qlik Sense on Windows needs to load large amounts of data from a database that is continuously updated
New records are added, and existing records get updated and deleted. Each record has a LastModified field.
All existing records are exported into a QVD file. The data architect wants to load the records into Qlik Sense efficiently.
Which steps should the data architect take to meet these requirements?
A. 1 Load the existing data from the QVD
2.
Load the new and updated data from the database without the rows that have just been loaded from the QVD and concatenate with data from the QVD
3.
Load all records from the key field from the database and use an INNER JOIN on the previous table
B. 1. Load the existing data from the QVD
2.
Load new and updated data from the database Concatenate with the table loaded from the QVD.
3.
Create a separate table for the deleted rows and use a WHERE NOT EXISTS to remove these records
C. 1. Use a partial LOAD to load new and updated data from the database.
2.
Load the existing data from the QVD without the updated rows that have just been loaded from the database and concatenate with the new and updated records
3.
Use the PEEK function to remove the deleted rows
D. 1 Load the new and updated data from the database.
2.
Load the existing data from the QVD without the updated rows that have just been loaded from the database and concatenate with the new and updated records.
3.
Load all records from the key field from the database and use an INNER JOIN on the previous table.
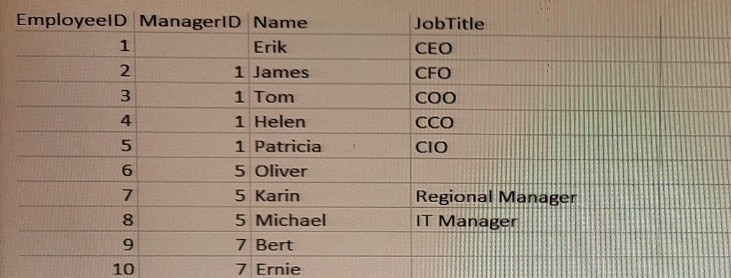
A Human Resources Director needs an app to analyze organizational structure. The Directory is particularly interested in the longest levels of line management. Two table loads are required. Both use the same basic structure.
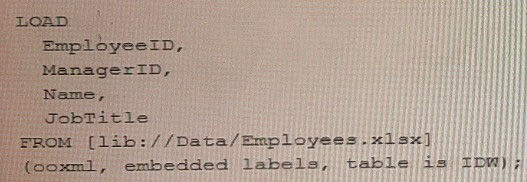
Which two table load prefixes are needed?
A. HierarchyLevel(EmployeelD, ManagerlD Name Level, '/', Structure) HierarchyBelongsTo(EmployeelD, ManagerlD, Name ManagerlD, Manager, Depth)
B. HierarchyBelongsTo(ManagerlD, Manager, ManagerlD, ManagerlD, Manager Level) Hierarchy(EmployeelD, ManagerlD, Name. Manager Name, Structure `/' Depth)
C. Hierarchy(EmployeelD. ManagerlD Name, Manager Name, Structure V, Depth) HierarchyLevelEmployeelD, ManagerlD, Name, Manager, Name, Structure, Depth `/')
D. HierarchyBelongs.To(EmployeeID, ManagerlD, Name ManagerlD, Manager, Depth)
A data architect needs to add the UnitCost field from the ProductCost table in the Dim_Products Table. Which script code should the data architect use?
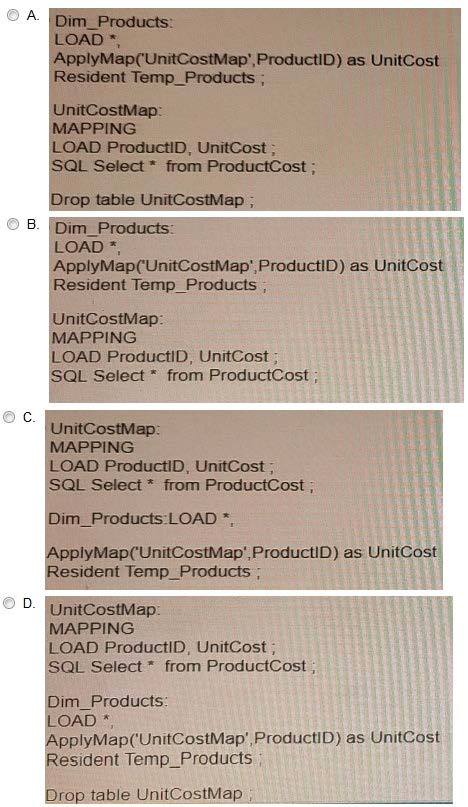
A. Option A
B. Option B
C. Option C
D. Option D
Refer to the exhibit.
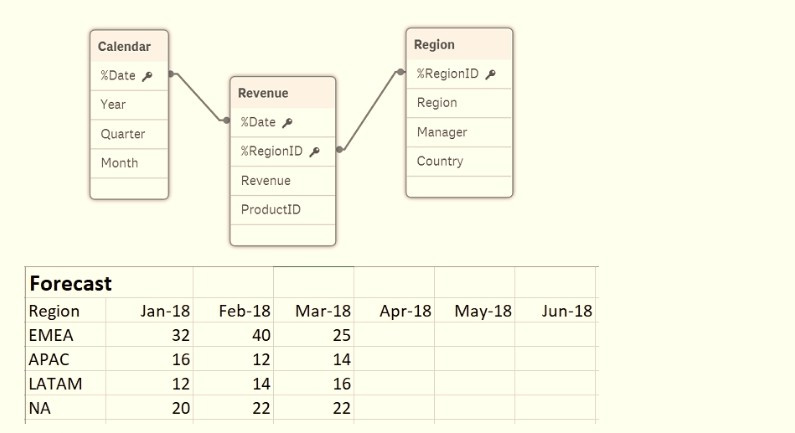
A business department is forecasting revenue within an Excel spreadsheet.
A data architect needs to include this forecast into the existing data model, and without losing any data.
Which two sets of steps will meet these requirements? (Select two.)
A. 1. Load the Excel spreadsheet using the data load editor
2.
Use the Unpivot function
3.
Use the Sum function to group the forecast by date
4.
Connect to the existing data model
B. 1. Load the Excel spreadsheet using the data load editor
2.
Use the Crosstable function to unpivot the table
3.
Create a composite key out of the date and region
4.
Connect the new table to the data model
C. 1 Load the Excel spreadsheet using the data load editor
2.
Change the sort order by date
3.
Create a composite key out of the forecast and region
4.
Connect to the existing data model
D. 1 Load the Excel spreadsheet into the data manager
2.
Use the Unpivot function
3.
Create a composite key from the date and region
4.
Connect the new table to the data model
E. 1. Load the Excel spreadsheet using the data manager
2.
Rename the ForecastDate field to Date
3.
Disable the Region
4.
Connect to the existing data model
A data architect needs to load data from two different databases Additional data will be added from a folder that contains QVDs. text files, and Excel files. What is the minimum number of data connections required?
A. Two
B. Five
C. Four
D. Three
