LOOKER-BUSINESS-ANALYST Online Practice Questions and Answers
An analyst wants to schedule a dashboard in a way that makes it easier for viewing on a mobile device or for viewing a printout of the dashboard.
How can the analyst set up a schedule to accomplish this?
A. Check Use single column layout in the Advanced options section of the scheduler.
B. Check Expand tables in the Advanced options section of the scheduler.
C. Select the paper size Tabloid with orientation Landscape in the Advanced options section of the scheduler.
D. Select Run schedule as recipient in the Advanced options section of the scheduler, and edit the recipient's user attribute preferences to be individual_images.
An analyst pins a dashboard from a personal folder to the team board. Other colleagues report that they cannot access the dashboard. There are a few dashboards in the personal folder that are not ready to share yet.
What should the analyst do to enable the team's access?
A. Give all users view access to the personal folder.
B. Move the dashboard to a shared folder and provide access only to the users from the team.
C. Give view access to the individual dashboards.
D. Create a subfolder in the personal folder and given view access to the users from the team.
A company has an operational dashboard that needs to display the latest data every 5 minutes on a monitor.
How should the analyst configure the dashboard?
A. Set the dashboard schedule to run every 5 minutes.
B. Set the dashboard auto refresh to 5 minutes.
C. Set the dashboard to run on load every 5 minutes.
D. Set the dashboard schedule to 5 minutes and "send if the results have changed".
Users find it difficult to distinguish the dashboards they need for tracking sales performance. There are more than 30 operation-related dashboards in the same folder.
What should the analyst do to improve the navigation experience?
A. Pin the dashboards into boards and grant user access to the individual dashboards.
B. Add descriptions to the dashboards to give more details.
C. Sort the dashboards in the folder by name.
D. Show the dashboards in a grid style for displaying the snapshot.
A global dashboard filter and the filter on a tile within that dashboard conflict because the global dashboard filter and the individual tile filter are based on the same field with different filter values.
What happens in this situation?
A. The filter values of both filters will combine in an additive manner and both filters will apply.
B. The individual tile's filter will override the global dashboard filter.
C. The global dashboard filter will override the individual tile filter.
D. The dashboard will break and warn the user that there are conflicting filter values.
A business analyst is creating an Explore that shows the number of hotel rooms booked per week, by room type. The analyst is using a Week dimension and a Count measure, and is provisioning on a Room Type dimension. Looking at the results, the Count of King rooms seems unusually low one week.
What should the analyst do to further investigate the low numbers?
A. Run the Explore again to make sure the results are the same.
B. Click on the Count measure where it is low to drill in to it.
C. Click on the Room Type dimension where it is King to drill in to it.
D. Remove the pivot on the Room Type dimension and re-run the Explore.
Two users report seeing different results on the same dashboard.
Which three configurations could explain these discrepancies? (Choose three.)
A. The time zone setting is different for each user.
B. Looker caching is affecting results.
C. The dashboard uses separate Explores for each user.
D. Dashboard filters are being used
E. The dashboard was accessed via different boards.
An analyst needs to compare monthly sales, year over year, based on when an order was created, as shown in the exhibit.
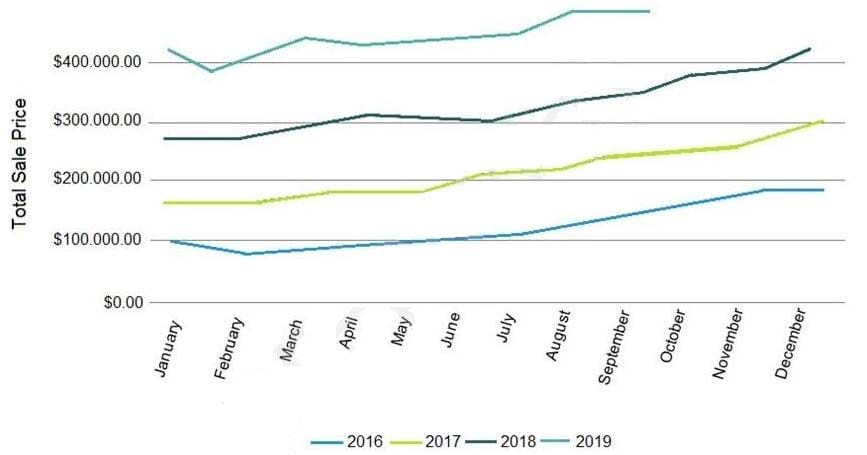
How should the analyst, in addition to selecting the measure Total Sales build the report?
A. Select the dimension Created Month, and pivot on the dimension Created Year.
B. Select the dimension Created Year, and pivot on the dimension Created Month.
C. Select the dimension Created Month Name, and pivot on the dimension Created Year.
D. Select the dimension Created Year, and pivot on the dimension Created Month Name.
An analyst for a movie producer is making an Explore query to show total box office revenue by movie. The initial query has three dimensions:
Ticket Purchase Month Movie Name Ticket Revenue
The analyst notices that the numbers look a lot smaller than expected and the results are difficult to
understand.
What should the analyst do to make the Explore query show the desired metric?
A. Remove the Month dimension and the Ticket Revenue dimension from the query. Add the Sum Revenue measure.
B. Remove the Ticket Revenue dimension from the query. Add the Sum Revenue measure.
C. Add the Sum Revenue measure to the query.
D. Add a table calculation that sums the Ticket Revenue dimension.
An analyst needs to display data from two different sources together. There is a Look for each data source, but there is no shared field that can be combined. Both Looks are saved in the Shared folder.
How should the analyst display the data from both sources?
A. use Merged Results to combine the data sources.
B. Ask the LookML developer to build a new Explore.
C. Add both Looks to a dashboard
D. Pin both Looks to a board.
A CEO wants to receive a daily email with the existing executive dashboard to review on a mobile device on the way to the office.
What should the analyst do to optimize the dashboard for mobile viewing?
A. Schedule the dashboard as HTML to adjust automatically.
B. Schedule the dashboard with the PDF format Use single column layout.
C. Create a mobile-friendly version of the dashboard by rearranging the tiles, and schedule the dashboard.
D. Schedule the dashboard with PDF paper size set to Fit Page to Dashboard.
An analyst needs to select all users in the query results but only wants to visualize results for users that have more than 100 orders.
Which visualization option should the analyst utilize?
A. Right-click to hide unwanted rows.
B. Limit displayed rows.
C. Use a custom filter.
D. Hide rows with table calculations.
The analyst is exploring weekly sales revenue in the last 3 months using a line chart. One requirement is to show the sales target $30,000 in the chart.
Which solution can help the analyst display the sales target?
A. Add a trend line for 30000.
B. Add a Tick Density of 30000.
C. Add a reference line for 30000.
D. Add a table calculation to hide values less than 30000.
An analyst is building out a company KPI dashboard and creates a blank dashboard. The analyst can
either create a new tile or use an existing Look.
What are two use cases for using Look-linked tile instead of building a query tile? (Choose two.)
A. The analyst wants to use the Look-linked tile in a separate company performance dashboard.
B. The analyst plans on creating a scheduled report of the associated Look.
C. The analyst is considering dashboard performance, and Look-linked tiles on dashboards lead to faster performance.
D. The analyst wants the flexibility to export the Look-linked tile results to additional file formats not supported by query tiles.
The query below shows how many uses purchased an item from each of two clothing departments.
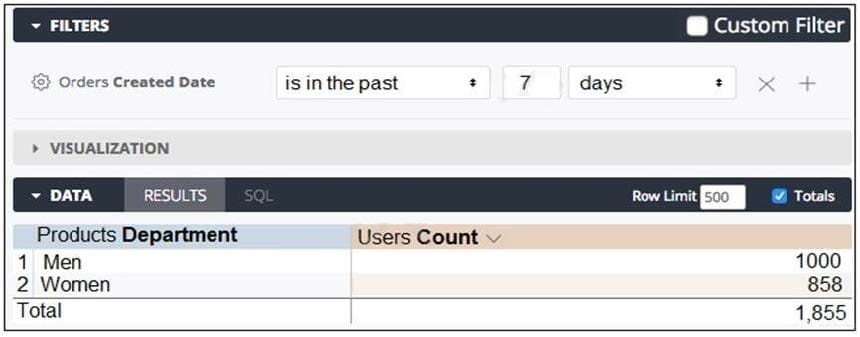
Why are the total and sum of the rows unequal?
A. There is a filter limiting the count in the Total row.
B. There is a faulty logic in the way users relate to clothing departments.
C. A user is only counted once in the total even if the user has purchased from both departments.
D. There are users who have never purchased a clothing item from either department.
Why select/choose certbus.com?
Millions of interested professionals can touch the destination of success in exams by certbus.com. products which would be available, affordable, updated and of really best quality to overcome the difficulties of any course outlines. Questions and Answers material is updated in highly outclass manner on regular basis and material is released periodically and is available in testing centers with whom we are maintaining our relationship to get latest material.
![]()
![]()
Copyright © 2004-2025 certbus.com, All Rights Reserved.