C2090-621 Online Practice Questions and Answers
A report author wants to nest a chart within a list and filter the chart data to relate to the row of the list that it is displayed in.
How can this be done?
A. Enable share result set on the list object.
B. Create a join in the Query explorer to merge the data.
C. Select the list and define a Master detail relationship.
D. Select the chart and define a Master detail relationship.
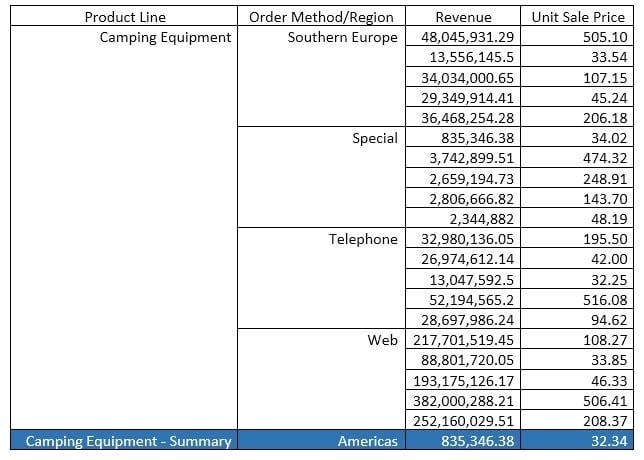
A report author has applied a Union set operation on two queries with the resultant query named Main_Query containing the data items: Product line, Order method/Region, Revenue and Unit Sale Price. The report author added the data items to the list, grouped on Product line and Order method/Region. The screenshot below shows the result:

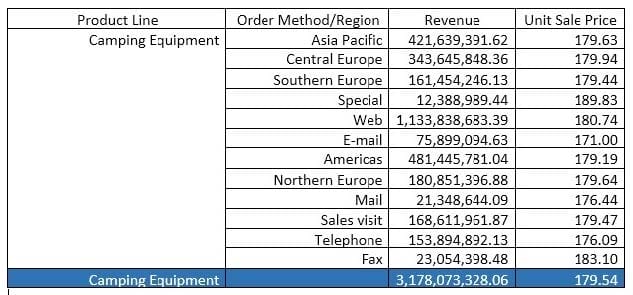
What must the report author do for the report to look like the following?

A. Set the detail aggregation property to Automatic for each field.
B. Set the detail aggregation property to None for product line and order method. Total for Revenue. Average for Unit Sale Price.
C. Set the detail aggregation property to None for only Product Line and Order Method. Automatic for Revenue. Average for Unit Sale Price.
D. Set the detail aggregation property to Default for product line and Order method. Default for Revenue and Average for Unit Sale Price.
A report author created a crosstab as shown below:

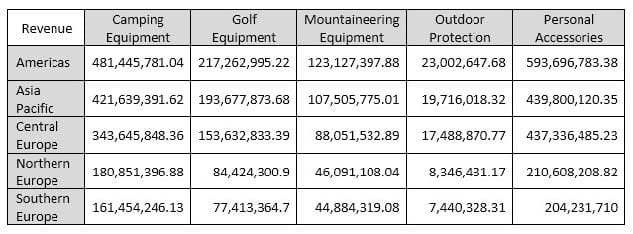
The crosstab report, when run, shows the following data:

The author wants to split the revenue for each region by year. Where should the year data item be added?
A. Below Region using a horizontal drop zone.
B. Above Region using a horizontal drop zone.
C. To the left of Region using a vertical drop zone.
D. To the right of Region using a vertical drop zone.
A report author wants to conditionally format data depending on a parameter value a user specifies at run time.
How can this be done?
A. By applying parameters directly in a variable.
B. By using an HTML item to implement the parameter.
C. By referencing a query item that uses the parameter.
D. By applying the parameter in the color and background section of the properties.
A report author has added a Button Bar control to an Active Report that allows users to view data for different regions. The report author now wants to make it possible for users to filter the report on multiple regions at once.
What should the report author do?
A. Use the Static version of the Button Bar control.
B. Use the Data-driven version of the Button Bar control.
C. Convert the Button Bar control to a Check Box Group control.
D. Convert the Button Bar control to a Radio Button Group control.
Which Data source can a report author connect to directly when creating a Dashboard?
A. a report
B. a Data set
C. a relational Data source
D. a locally saved Excel file
A customer has a bar chart in a report that displays a steady increase in revenue by product line over time. The requirement is to graphically illustrate this progression in the data series without significantly the report.
How can this be done?
A. Add a linear trendline to the chart.
B. Add a polynomial trendline to the chart.
C. Create and insert graphics to highlight the data points.
D. Hide data values within the chart and make the bars larger.
Which properties must be set when using a SQL object?
A. Data source and SQL
B. Package name and SQL
C. Cardinality and namespace
D. Primary Key and namespace
