E20-026 Online Practice Questions and Answers
In which lifecycle stage are test and training data sets created?
A. Model building
B. Model planning
C. Discovery
D. Data preparation
When creating a presentation for a technical audience, what is the main objective?
A. Show that you met the project goals
B. Show how you met the project goals
C. Show if the model will meet the SLA
D. Show the technique to be used in the production environment
Data visualization is used in the final presentation of an analytics project. For what else is this technique commonly used?
A. Data exploration
B. Descriptive statistics
C. ETLT
D. Model selection
When creating a project sponsor presentation, what is the main objective?
A. Show that you met the project goals
B. Show how you met the project goals
C. Show how well the model will meet the SLA (service level agreement)
D. Clearly describe the methods and techniques used
Consider a scale that has five (5) values that range from "not important" to "very important". Which data classification best describes this data?
A. Ordinal
B. Nominal
C. Real
D. Ratio
You are asked to write a report on how specific variables impact your client's sales using a data set
provided to you by the client. The data includes 15 variables that the client views as directly related to
sales, and you are restricted to these variables only.
After a preliminary analysis of the data, the following findings were made:
1.
Multicollinearity is not an issue among the variables
2.
Only three variables--A, B, and C--have significant correlation with sales You build a linear regression model on the dependent variable of sales with the independent variables of A, B, and C. The results of the regression are seen in the exhibit. You cannot request additional datA. what is a way that you could try to increase the R2 of the model without artificially inflating it?
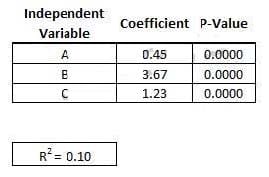
A. Create clusters based on the data and use them as model inputs
B. Force all 15 variables into the model as independent variables
C. Create interaction variables based only on variables A,B,and C
D. Break variables A,B,and C into their own univariate models
Trend, seasonal, and cyclical are components of a time series. What is another component?
A. Irregular
B. Linear
C. Quadratic
D. Exponential
What is LOESS used for?
A. It fits a smoothed curve to scatterplot data,to give a general sense of the data's behavior.
B. It is a significance test for the correlation between two variables.
C. It plots a continuous variable versus a discrete variable,to compare distributions across classes.
D. It is run after a one-way ANOVA,to determine which population has the highest mean value.
In linear regression modeling, which action can be taken to improve the linearity of the relationship between the dependent and independent variables?
A. Apply a transformation to a variable
B. Use a different statistical package
C. Calculate the R-Squared value
D. Change the units of measurement on the independent variable
What is the primary bottleneck in text classification?
A. The availablilty of tagged training data.
B. The ability to parse unstructured text data.
C. The high dimensionality of text data.
D. The fact that text corpora are dynamic.
Your customer provided you with 2, 000 unlabeled records and asked you to separate them into three groups. What is the correct analytical method to use?
A. K-means clustering
B. Linear regression
C. Naive Bayesian classification
D. Logistic regression
Refer to the exhibit.
Which type of data issue would you suspect based on the exhibit?
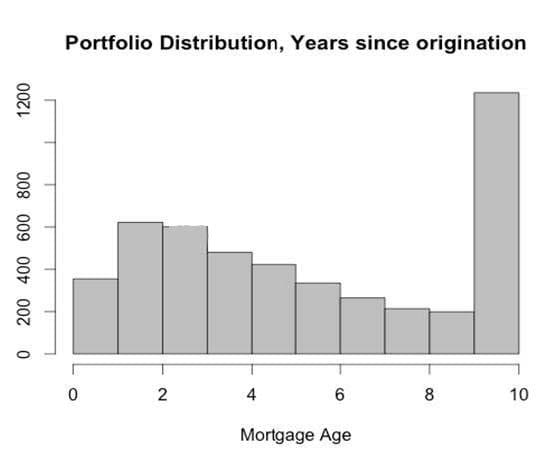
A. "Saturated" data,indicating potential issues with data definitions
B. Incomplete data,indicating potential issues with data transmission
C. Mis-scaled data,indicating potential issues with data entry
D. The exhibit does not raise any obvious concerns with the data.
Refer to the exhibit. Click on the calculator icon in the upper left corner. An analyst is searching a corpus of documents for the topic "solid state disk". In the Exhibit, Table A provides the inverse document frequency for each term across the corpus. Table B provides each term's frequency in four documents selected from corpus. Which of the four documents is most relevant to the analyst's search?
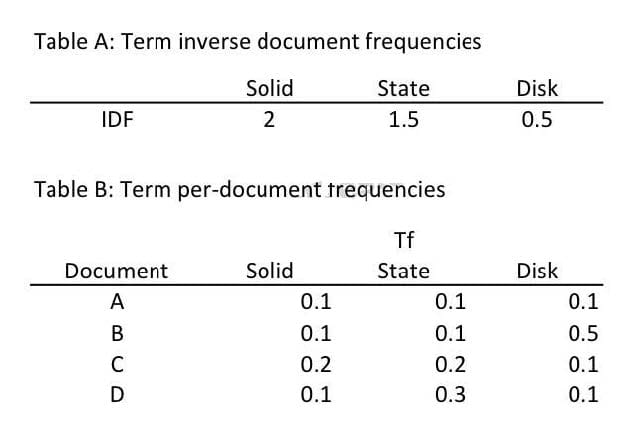
A. Document C
B. Document A
C. Document B
D. Document D
Refer to the exhibit.
You have scored your Naive bayesian classifier model on a hold out test data for cross validation and
determined the way the samples scored and tabulated them as shown in the exhibit. What are the the
False Positive Rate (FPR) and the False Negative Rate (FNR) of the model?
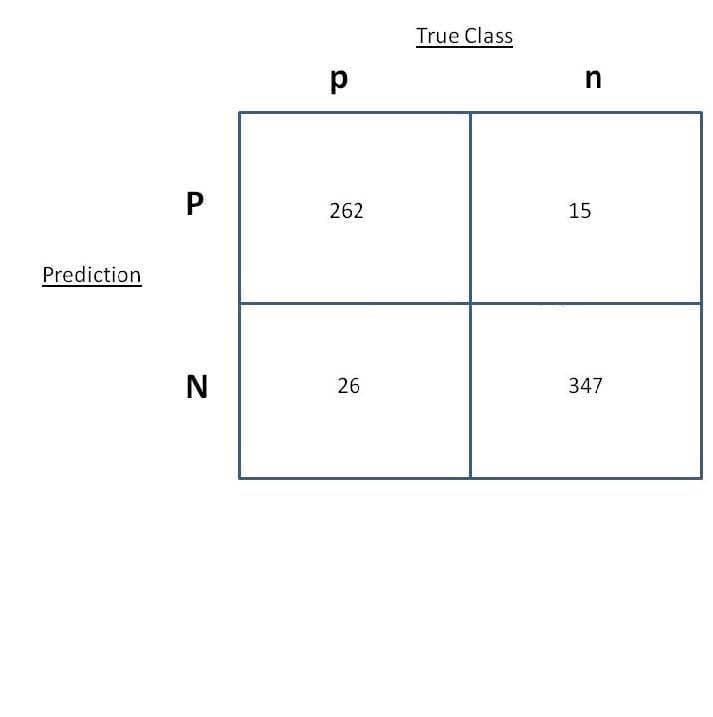
A. FPR = 15/262 FNR = 26/288
B. FPR = 26/288 FNR = 15/262
C. FPR = 262/15 FNR = 288/26
D. FPR = 288/26 FNR = 262/15
Refer to the exhibit.
Click on the calculator icon in the upper left corner. You are going into a meeting where you know your
manager will have a question on your dataset -- specifically relating to customers that are classified as
renters with good credit status.
In order to prepare for the meeting, you create a rule: RENTER => GOOD CREDIT. What is the
confidence of the rule?
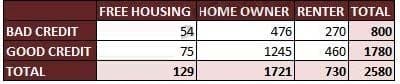
A. 63%
B. 41%
C. 18%
D. 73%
Why select/choose certbus.com?
Millions of interested professionals can touch the destination of success in exams by certbus.com. products which would be available, affordable, updated and of really best quality to overcome the difficulties of any course outlines. Questions and Answers material is updated in highly outclass manner on regular basis and material is released periodically and is available in testing centers with whom we are maintaining our relationship to get latest material.
![]()
![]()
Copyright © 2004-2025 certbus.com, All Rights Reserved.