CLSSYB Online Practice Questions and Answers
When doing Hypothesis Testing on Non-normal data Belts will use a _____ to compare more than two sample proportions to each other.
A. Z score Table
B. Sakami Table
C. Mean-to-Mode Analysis
D. Contingency Table
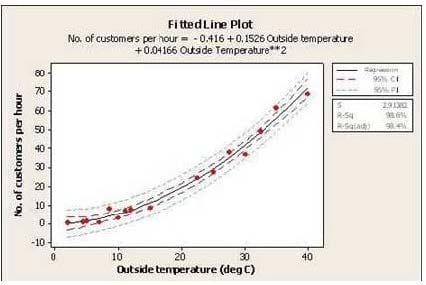
Which statement is correct about the Regression shown here?

A. The dependent variable is the outside temperature
B. The relationship between outside temperature and number of customers per hour is a Linear Regression
C. The dashed lines indicate with 95% confidence where all of the process data should fall between
D. The dashed lines indicate with 95% confidence the estimate for the Quadratic Regression Line
The practice of utilizing Mistake Proofing is also known as ________________.
A. Thorough integration
B. Lean controls
C. On site inspection
D. Poka-Yoke
Ratio and Interval Scale of measurements are based on _____ type of data:
A. Discrete and Attribute
B. Discrete and Continuous
C. Variable and Continuous
D. Continuous and Attribute
A software development process has UAT Defect density as Y, percent review effectiveness as X1 and percent design phase effort as X2. Indicate the type of regression model Y= -0.1320 X1 + 0.16 X2 +
23.200.
A. Single Linear Regression
B. Dummy Variable Regression
C. Multi Linear Regression
D. Logistic Regression
Three Standard Deviations on left and right side of the mean would include what % of the total data points in Normal Distribution?
A. 68 %
B. 97 %
C. 99 %
D. 95 %
You are a Project Manager wanting to compare on time delivery (%) of Team Leads across 4 teams, your choice of technique would be?
A. Hypothesis Testing
B. Histograms
C. Pareto chart
D. Box Plots
Six sigma helps in:
A. reducing variation, removing waste and improving the process
B. improving the PandL
C. understanding customer specifications and billing the customer for the expenses
D. reviewing the process from time to time and increasing profitability
1990's saw the introduction of the:
A. Pareto analysis
B. Big data
C. Balanced Scorecard
D. TQM
The purpose of ________________ is to analyze data and present it in a way we can make informed
decisions as to what is happening in our process.
A. Data Sampling
B. Basic Statistics
C. Calculating Standard Deviation
D. Measurement System Analysis
As we attempt to find a commonality of terms to assess the performance of a broad range of processes we use a key metric called the DPMO which stands for __________________________?
A. Delayed production metrics output
B. Defects by management oversight
C. Defects per million opportunities
D. Developed production management oversight
In order to properly draft a Process Map at the start of a project we are told to __________________ from beginning to the end.
A. Interview the line operators
B. Walk the process
C. Chat with supervisors
D. Check the repair stations
_____________ represents all the variation that one can expect to experience from the output of the subject process.
A. A Standard Deviation
B. Data range
C. Long-term Data
D. The Mode
Lean Principles defines for us seven specific areas where ________ typically exists in our processes.
A. Waste
B. Excess inventory
C. Variation
D. Data error
To minimize waste through the application of Lean Principles we do which of the following?
A. Collect sample data
B. Keep the work area clean and organized
C. Calibrate our measurement tools
D. Survey the customer
